Table of Contents
- 1. Introduction
- 2. Running MonAMI
- 3. Configuring MonAMI
- 4. Security
- 5. Further Information
List of Figures
- 1.1. Illustration of MonAMI architecture
- 1.2. Illustration of the three data flows
- 3.1. Data from DPM displayed within Ganglia.
- 3.2. Ganglia graphs showing data from dpm and tcp targets
- 3.3. gr_Monitor showing data from apache and mysql targets
- 3.4. KSysGuard showing data from the nut plugin
- 3.5. Example deployment with key elements of MonALISA shown.
- 3.6. Nagios service status page showing two MonAMI-provided outputs.
- 3.7. Adaptive monitoring increasing sampling interval in response to excessive server load.
This document describes how to configure and run MonAMI: a universal sensor infrastructure. Following the Unix philosophy, it aims to do a simple job well. That job is to move monitoring information from a service into a monitoring system. It does not attempt to store monitoring information or display (graphically) the data, as other systems exist that already do this. Rather, it aims to interface well with existing software.
To understand how MonAMI may be configured, a brief introduction to the underlying ideas of MonAMI must be given. This introduction chapter will give an overview of how MonAMI allows monitoring information to flow. This is important as later chapters (which describe specific aspects of MonAMI) may be confusing without a clear understanding of the “big picture.”
It is worth stressing at this stage that monitoring is a more involved process than merely periodically collecting data. Without a clear understanding of this, MonAMI may appear superfluous!
In essence, MonAMI allows the collection of information from one or more services. This information is then sent off, perhaps to some data storage or to be displayed within some monitoring software. This gathering of information can be triggered by MonAMI internally or from an external agent, depending on how MonAMI is configured.
MonAMI has two parts: a core infrastructure and a set of plugins. Plugins do the more immediately useful activity, such as collecting information and sending the information somewhere. There are broadly two classes of plugins: monitoring plugins and reporting plugins.
Monitoring plugins can collect information from a specific source; for example, the MySQL plugin (described in Section 3.4.8, “MySQL”) can collect the current performance of a MySQL database. A configured monitoring plugin will act as a source of monitoring information.
Reporting plugins store gathered information or send it to some monitoring system. For example, the filelog plugin (described in Section 3.5.1, “filelog”) will store information as a single line within a log file, each line starting with the appropriate date/time stamp information. Another example is the Ganglia plugin (see Section 3.5.3, “Ganglia”), which sends network packets containing the information so that an existing Ganglia monitoring system can display the information. A configured reporting plugin will act as a sink of information.
A target is a configured instance of a plugin, one that is monitoring something specific or sending information to a specific information system. MonAMI can be configured so it has many MySQL targets, each monitoring target monitoring a different MySQL database server. Another example is when the filelog plugin is used to log data to different files. Although there is only ever one filelog plugin, there are many filelog targets, one per file.
MonAMI-core provides the infrastructure that allows gathered information (provided by monitoring plugins) to be sent to reporting plugins (which send the information off to where it is needed). MonAMI-core also handles internal bookkeeping and the functionality common between plugins, such as reading configuration files and caching results.

Several useful plugins (both monitoring and reporting) are
included with the default distribution. However, MonAMI aims to
be extensible. Writing a new monitoring plugin allows data to
be sent to any of the existing reporting plugins; writing a new
reporting plugin allows any of the MonAMI data to be sent to a
new storage or monitoring system. Instructions on how to write
new plugins are given in the developers guide (the file
README.developers).
A monitoring agent (such as MonAMI) is charged with the job of marshalling information from one or more systems (usually local to the agent) to some other system (often remote). Whether we are monitoring a database for performance problems, keeping a watchful eye on missing web pages or plotting a graph to see how many users are logged in over time, all monitoring activity can be understood as consisting of three abstract components: the monitoring target, the monitoring agent and the information system. In this context, the monitoring agent is MonAMI. The monitoring target might be a database, webserver or the operating system's current-user information. The information system might be a log file, web page or some distributed monitoring system, such as Ganglia (Section 3.5.3, “Ganglia”) or Nagios (Section 3.5.9, “Nagios”).
Unlike mechanical monitoring systems (see, for example, the Watt governor), computers work in discrete units of time. In a multitasking operating system any monitoring activity must be triggered by something outside the monitoring system. From the three components, we can describe three monitoring flows based on which component triggered the monitoring activity. If the information system triggered the monitoring activity, the monitoring is on-demand; monitoring that is triggered within the agent (i.e. triggered internally within MonAMI) is internally-triggered; if the service triggered the monitoring, due to some service-related activity, the monitoring is event-based.
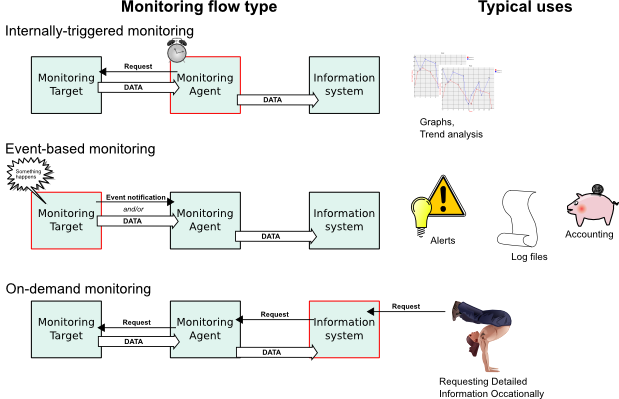
Internally-triggered monitoring is perhaps the most common. An example of internally-triggered monitoring is periodically asking for (and recording somewhere) the current status of some service. We might ask an Apache web-server the current activity of its threads; we might ask a MySQL database how many times its query-cache has been useful. These questions can be asked at any time. Typically the values are queried at regular intervals and the results are plotted on a graph.
With on-demand monitoring, some external agent asks for data. An example of on-demand monitoring would be a web-page that returned the current status of a database: the information could be gathered only when queried by a user. The external agent can request information at any time, although in practice, requests are often periodic. A major benefit of on-demand monitoring flows is that it allows the monitoring requirements to vary dynamically as greater or lesser volume of information is requested. A potential problem with on-demand monitoring is with requests overloading the monitoring system. MonAMI provides some protection against this by allowing the enforcement of a caching policy (see Section 3.3.2, “The cache attribute”).
The third monitoring flow is event-based monitoring. Events are triggered by the monitoring target (e.g., the Apache server). The target (such as an Apache server) sends information voluntarily at an unpredictable time, usually due to something happening externally. Event monitoring flow is most often used to record that “something” has happened; for example that a web download has completed.
A plugin that supports event-based monitoring flow makes the
events available in different channels.
One can subscribe to one or more channels. Information from
that channel is then sent to one or more reporting targets. For
example, the Apache web-server monitoring plugin (see Section 3.4.2, “Apache”) can produce an event for each attempted
HTTP transfer (whether successful or not) as the
access channel, so subscribing to the
apache target's access channel would
provide information on all transfers. A subscription can be
more more specific: the channel access.4xx
provides information on only those transfers resulting in an
error status-code, and subscribing to
access.4xx.404 will report on only missing
page (status-code 404) events.
Explicit examples of each of the three event flows are given in
Section 3.8, “Example configurations”. Although the examples rely on an
understanding of the monami.conf format
(which Chapter 3, Configuring MonAMI documents in detail), the
examples (along with the accompanying notes) should be fairly
obvious.
When monitoring something (a service, for example) it is rare that the current status is described by a single metric. Although you might only want a tiny subset of the available information, the current status is usually described by a vast slew of data. We want a convenient concept that allows the data to be grouped together, allowing easy selection of the interesting subsets.
A datatree is a collection of related information. As the name suggests, the metrics are held in a tree structure, analogous to a filesystem. A datatree has branches (like “directories” or “folders”) each of which contains measurements (like files) and further branches. In general, branches are generic concepts and the data underneath the branches are measurements of the generic concept.
A typical datatree is represented below. Here, the
Threads branch contains data related to the
generic concept of threads, each of which might be undertaking
one of several different activites. The data underneath the
Threads branch (waiting,
starting, etc.) are the number of threads in
the respective state (“waiting for a connection”,
“starting up”, etc..)
Apache
 |
 +--Workers
 |   |
 |   +--busy: 1
 |   |
 |   +--idle: 49
 |
 +--Threads
     |
     +--waiting: 49
     |
     +--starting: 0
     |
     +--reading: 0
     |
     +--replying: 1
     |
     +--keep-alive: 0
     |
     +--dns: 0
     |
     +--closing: 0
     |
     +--logging: 0
     |
     +--graceful exit: 0
     |
     +--idle: 0
     |
     +--unused: 0
Each item of data is usually referred to by its full path
separated by periods (.), excluding the root
node. For example, the number of Apache threads currently
replying with requested information is
Threads.replying. In the above example,
Threads.replying has a value of
1.
Each metric has multiple elements of metadata. They all have a
name (e.g., Threads.replying), a value
(1 for Threads.replying
in above example), a type (integer, floating-point number,
string, etc...), a string describing in what units the
measurement was taken (with numerical data and where
appropriate) and some additional binary metadata such as
whether the information is static, a counter or reflects
current status.
Datatrees can be combined to form larger datatrees; or subtrees can be selected, limiting the information delivered. Details of how to do this are given in Section 3.6.1, “The read attribute”.
Table of Contents
In this section, the various modes of running MonAMI are discussed. In most production environments, MonAMI runs as a single detached process (a daemon), launched from the system start-up scripts (the init scripts), as described in Section 2.3, “Running in production environment”. Other modes of running monamid, such as testing a new configuration, are also discussed.
The MonAMI application (monamid)
accepts only a limited number of options as most of the
behaviour is controlled by the configuration file
(/home/paul/MonAMI-test-install/etc/monami.conf). The format of
this configuration file is described in a later section of this
guide (Chapter 3, Configuring MonAMI).
The following options are available for the monamid application.
monamid [-f] [-h] [-v] [-V] [--pid-file file]
-for--no-daemonrun in the foreground, i.e. do not detach from current terminal. Unless explicitly configured in
monami.conf, logging output will be sent tostdoutorstderr.-hor--helpdisplay a brief synopsis of available options.
-vor--verboseshow more of the logging information. MonAMI aims to be a quiet application. By default it will only report problems that are from extern resources or that are due to configuration that is inconsistent. With the
-voption specified extra information is reported that, whilst not necessarily reporting an error, is indicative of potentially abnormal activity. This is often useful when MonAMI is not behaving as expected.This option can be repeated to include extra debugging information; information useful when tracking down programming problems within MonAMI.
-Vor--versiondisplay the version of MonAMI and exit.
--pid-filefilestore the PID of monamid in
file, creatingfileif it does not already exist.
Without the -f option, the MonAMI application
(monamid) will assume it is running
in a production environment and will detach itself from the
terminal. The init scripts for
starting MonAMI also make this assumption, and run
monamid without the
-f option.
When first using MonAMI, or when investigating a new
configuration, it is often easier to understand any problems if
the application does not detach from the terminal and continues
to display output to the terminal. When experimenting, it is
recommended to run MonAMI with the -f
(foreground) and -v (verbose) command-line
options. As with other command-line options these can be
combined, so to test-run MonAMI, one can use the following:
/usr/bin/monamid -fv.
In normal operation, MonAMI will detach itself and run
independently as a background task. Typically, one would want
to run MonAMI automatically when a computer starts up. The de
facto method of achieving this is with
init scripts. MonAMI includes a
suitable script, which is stored in the
/home/paul/MonAMI-test-install/etc/init.d directory.
When installing MonAMI (either with the RPM package or manually
with "make install") a suitable "init script" will be installed
in the /home/paul/MonAMI-test-install/etc/init.d directory. Once this is
done, a further two steps are needed: to register the new init
script with the system and "switch on" MonAMI. On RedHat-like
machines, this is achieved with the following two commands:
chkconfig monami on
To manually start or stop MonAMI, one can use the init scripts,
with either the start or stop
option. You can either execute the script directly:
/etc/init.d/monami start
or using the "service" command.
service monami start
The complete list of arguments the init script accepts is:
startUnconditionally attempt to start monamid. If monamid is already running, this attempt will fail.
stopUnconditionally stops monamid. If the application is not already running, then this will (obviously) fail.
reloadSignals MonAMI to reload its configuration. This will only happen if monamid is running: if the application is not running, this will fail. The reload is achieved without stopping and starting monamid.
restartUnconditionally stop and start MonAMI. If monamid was not running, an error is reported and the application is started.
condrestartIf MonAMI is running, then stop monamid and restart it. If the application is not running, then no action is taken.
Finally, as an aid to development work, one can run MonAMI from within the CVS tree.
With the configuration, if MonAMI fails to find the configuration
file in the configured location
(/home/paul/MonAMI-test-install/etc/monami.conf), it will look for
monami.conf within the current working
directory.
For plugins, MonAMI will first look in the configured plugin
directory (/home/paul/MonAMI-test-install/lib/monami). If this directory
does not exist, or contains no plugins, then the
plugin directory within the current directory
is examined. The src/plugin directory is
where plugins are placed as they are built.
MonAMI will run within CVS provided that the "current working
directory" is src and the CVS-configured
MonAMI does not share the same prefix as an installed MonAMI
instance. It is recommended not to run an installed MonAMI on a
development machine and to use the -f
command-line option when running
monamid from the CVS directory tree.
Table of Contents
MonAMI looks for the configuration file
monami.conf. It will first look for this
file in the /home/paul/MonAMI-test-install/etc
directory. If monami.conf is not found
there, the program will check the current directory. If the
configuration file still cannot be found, MonAMI will exit with
error code 1.
The configuration file can describe four things:
configuration for MonAMI, independent of specific monitoring,
which services need monitoring (the monitoring targets) and how to get that information,
where information should be sent (the reporting targets),
how data should flow from the monitoring targets to the reporting target.
As will be discussed later, it is possible to split parts of MonAMI configuration into different files. This allows a set of monitoring definitions to be stated independently of other monitoring activity, which may prove useful when MonAMI is satisfying multiple groups requiring monitoring of services.
Comments can be included by starting a line with the hash
(#) symbol. White space (consisting of space or
tab characters) before the hash symbol is allowed in comment
lines.
Each configuration file is split into multiple stanzas (or sections). Each stanza has a section title line followed by zero or more attribute lines.
A section title is a line containing a word in square brackets
("[mysql]" for example). The case used for the
section title does not matter: "[MySQL]",
"[mysql]" and "[mySQL]" can be used
interchangeably.
All lines following a section title line until the next section
title line (or the end of the file) must be either a blank line,
a comment line or an attribute line. Attribute lines are
keyword-value pairs separated by an equals symbol
("="), for example:
name = myMonitor
White space at the start of the line, either side of the equals symbol and at the end of the line is ignored. Other white space, if significant, is preserved.
If a line ends with a back-slash symbol ("\") then
that line and the one following it are combined into a single
line. This can be repeated, allowing a single very long line to
be broken into several shorter (and more manageable) lines; each
of the shorter lines, except the last one, must end with a
back-slash symbol.
Example configuration files are include in Section 3.8, “Example configurations”.
The following sections describe the different sections that may appear in a configuration file, along with the valid assignment lines that further refine MonAMI behaviour.
One one stanza entitled "monami" is allowed:
subsequent monami stanzas will be silently ignored.
The MonAMI section describes how MonAMI-core should run.
MonAMI provides messages containing information about events
that occur during runtime. The destination of these messages
is controlled by a set of configuration parameters that all
begin with "log".
Each message has a severity; the four severity levels are:
- critical
no further execution is possible, MonAMI will stop immediately.
- error
something went wrong. It is possible to continue running but with (potentially) reduced functionality. Errors might be rectified by altering MonAMI configuration.
- info
a message that, whilst not indicating that there was an error, is part of a limited commentary that might be useful in deciphering apparently bizarre behaviour.
- debug
a message that is useful in determining why some internal inconsistency has arisen. The information provided is tediously verbose and only likely of use when finding problems within the MonAMI program and plugins.
The destination of messages (and whether certain messages
are ignored) can be configured on the command line, or
within the [monami] section of the
configuration file.
Normally, a user is only interested in "critical" and
"error" messages. If MonAMI is not working correctly, then
examining the messages with "info" severity might provide a
clue. Supplying the -v command-line option
tells MonAMI to return info messages.
If MonAMI is running as a normal process (using the
-f option), then critical and error
messages are sent to standard error (stderr) and other message
severity levels are ignored. If MonAMI is running verbosely
(using the -v option) then info messages
are sent to standard output (stdout), if running more
verbosely (with -vv) then the debug
messages are also sent to stdout.
If MonAMI is running as a daemon (i.e. without the
-f command-line option) then, by default,
critical and error messages are sent to syslog (using the
"daemon" facility), info is ignored (unless running with the
verbose option: -v) and debug is ignored
(unless running more verbosely: -vv). Any
messages generated before MonAMI has detached itself are
either sent to stdout, stderr or ignored.
Other destinations are defined as follows:
- An absolute file location (i.e. beginning with
"
/") This is treated as a file destination. The message is appended to the file, creating the file if necessary.
- syslog
indicates the message should be sent to syslog daemon facility.
- ignore
indicates the message should be ignored.
- stderr
sends the message to standard-error output.
- stdout
sends the message to standard output.
Some examples:
[monami]
  # ignore all but critical errors
  log          = ignore
  log_critical = syslog
[monami]
  # store critical and error messages in separate files
  log          = ignore
  log_critical = /var/log/monami/critical.log
  log_error    = /var/log/monami/error.log
MonAMI needs no special privileges to run. In common with other applications, it is possible that some bug in MonAMI be exploitable and allow a local (or worse, remote) user to compromise the local system. To reduce the impact of this, it is common for an application to “drop” their elevated privileges (if running with any) soon after they start.
There are two options within the configuration file to control this: user and group. The user option tells MonAMI to switch its user-ID to that of the supplied user and to switch group-ID to the default group for that user. The group option overrides the user's default group, with MonAMI adopting the group-ID specified.
In the following example, the [monami] stanza
tells MonAMI to drop root privileges and assume the
identity of user monami and group monitors.
[monami]
  user  = monami
  group = monitors
Often, a server may have multiple services running concurrently. Maintaining a monolithic configuration file containing the different monitoring requirements may be difficult as services are added or removed.
To get around this problem, MonAMI will load all the
configuration files that end .conf
within a named directory (/home/paul/MonAMI-test-install/etc/monami.d). If a
new service has been installed, additional monitoring can be
indicated by copying a suitable file into the /home/paul/MonAMI-test-install/etc/monami.d
directory. When the service has been removed the
corresponding file in /home/paul/MonAMI-test-install/etc/monami.d can be
deleted.
Auxiliary configuration directories are specified with the
config_dir option. This option can occur
multiple times in a [monami] stanza. For
example:
[monami]
  config_dir = /etc/monami.d
Summary of possible attributes within the
[monami] stanza:
- log, string, optional
change the default destination for all message severity levels. This overwrites the built-in default behaviour, but is overwritten by any severity-specific options.
- log_critical, string, optional
change the destination for critical messages. This overwrites any other destination option for critical messages.
- log_error, string, optional
change the destination for error messages. This overwrites any other destination option for error messages.
- log_info, string, optional
change the destination for info messages. This overwrites any other destination option for info messages.
- log_debug, string, optional
change the destination for debugging messages. This overwrites any other destination option for debug messages.
- user, string, optional
The user-name or user-id of the account MonAMI should use. By default, MonAMI will also adopt the corresponding group ID.
- group, string, optional
The group-name or group-id of the group MonAMI should use. This will override the group ID corresponding to the user option.
- config_dir, string, optional
A directory that contains additional configuration files. Each file ending
.confis read and processed, but anymonamistanzas are ignored. Its recommended that this directory be only readable by the user account that MonAMI will run under.
There are some features that are common to each of the plugins. Rather than repeat the same information under each plugin's description, the information is presented here.
Each distinct service has a separate stanza within the
configuration file, using the plugin name. Considering the
apache monitoring plugin (which monitors an Apache
HTTP webserver) as an example, one can monitor multiple
Apache webservers with several separate
[apache] stanzas: one for each monitoring
target. To illustrate this, the following configuration
describes how to monitor an intranet web server and an
external web server.
[apache]
 name = external-webserver
 host = www.example.org

[apache]
 name = internal-webserver
 host = www.intranet.example.org
Each target must have a unique name. It is possible to specify the name a target will adopt with the name attribute (as in the above example). If no name attribute is given, the target take the name of the plugin by default. However, since all names must be unique, only one target can adopt the default name: all subsequent targets (from this plugin) must have their name specified explicitly using the name attribute.
Although specifying a name is optional, it is often useful to set a name explicitly (preferably to something meaningful). Simple configuration files will work fine without explicitly specifying target names, whilst configuration files describing more complex monitoring requirements will likely fail unless they have explicitly named targets.
If there is an ambiguity (due to different targets having the same name) MonAMI will attempt to monitor as much as possible (to “degrade gracefully”) but some loss of functionality is inevitable.
Acquiring the current status of a service will inevitably take resources (such as CPU time and perhaps disk space) away from the service. For some services this effort is minimal, for others it is more substantial. Whatever the burden, there will be some monitoring frequency above which monitoring will impact strongly on service provision.
To prevent overloading a service, the results from querying a service are stored within MonAMI for a period. If there is a subsequent request for the current state of the target within that period then the stored results are used rather than directly querying the underlying service: the results are cached.
The cache retention period is adjustable for each target and can be set with the cache attribute. The cache attribute value is the time for which data is retained, or (equivalently) the guaranteed minimum time between successive queries to the underlying service.
The value is specified using the standard time-interval
notation: one or more numbers each followed by a single
letter modifier. The modifiers are s,
m, h and
d for seconds, minutes, hours and days
respectively. If a qualifier is omitted, seconds is
assumed. The total cache retention period is the sum of the
time. For example 5m 10s is five minutes
and ten seconds and is equivalent to specifying
310.
In the following example configuration file, the MySQL queries are cached for a minute whilst the Apache queries are cached for 2 seconds:
[apache]
 host = www.example.org
 cache = 2

[mysql]
 host = mysql-serv.example.org
 user = monami
 password = monami-secret
 cache = 1m
If no cache retention period is specified, a default value of one second is used. Since MonAMI operates at the granularity of one second, there is apparently no effect on individual monitoring activity, yet we ensure that targets are queried no more often than once a second.
For many services, a one second cache retention time is too short and the cached data should be retained for longer; yet if the cache retention time is set for too long, transitory behaviour will not be detectable. A balance must be struck, which (most likely) will need some experimentation.
The map attribute describes how additional information is to be added to an incoming datatree. When a datatree is sent to a target that has one or more map attributes it is first processed to alter the incoming datatree. To the target, the additional metrics provided by map attributes are indistinguishable from those of the original datatree.
The map attribute values take the following form:
map =target metric:source
The value of target
metric.) within target
metric
The source
String-literals are a string metric
that never change: they have a fixed value independent of
any monitoring activity. A string-literal starts and ends
with a double-quote symbol (") and can
have any content in between. Since MonAMI aims at providing
monitoring information, the use of string literals is
discouraged.
A special is something that provides
some very basic information about the computer: sufficiently
basic that providing the information via a plugin is
unnecessary. A special is represented by its name contained
in angle-brackets (< and
>). The following specials are
available:
FQDNthe Fully Qualified Domain Name of the machine. This is the full DNS name of the computer; for example,
www.example.org.
The follow simple, stand-alone MonAMI configuration illustrates map attributes.
[null]

[sample]
 read = null
 write = snapshot
 interval = 1

[snapshot]
 filename = /tmp/monami-snapshot
 map = tests.string-literal.first : "this is a string-literal"
 map = tests.special.fqdn : <FQDN>
 map = tests.string-literal.second : "this is also a \
                   string-literal"
The null plugin (see Section 3.4.9, “null”)
produces datatrees with no data. Without the
map attributes, the snapshot would
produce an empty file at
/tmp/monami-snapshot. The
map attributes add additional metrics
to otherwise-empty datatrees. This is reflected in the
contents of /tmp/monami-snapshot.
The process of gathering monitoring data from a service is not instantaneous. In general, there will be a delay between MonAMI requesting the data and it receiving that data. The length of this delay may depend on several factors, but is likely to depend strongly on the software being monitored and how busy is the server.
Whenever MonAMI receives data, it makes a note of how long this data-gathering took. MonAMI uses this information to maintain an estimate for the time needed for the next request for data from this monitoring target.
This estimate is available to all plugins, but currently
only two use it: ganglia and
sample. The ganglia
plugin passes this information on to Ganglia as the
dmax value (see Section 3.5.3, “dmax”)
and the sample plugin uses this information to
achieve adaptive monitoring (see Section 3.6.4, “Adaptive monitoring”).
When maintaining an estimate of the next data-gathering delay, MonAMI takes a somewhat pessimistic view. It assumes that data-gathering will take as long as the longest observed delay, unless there is strong evidence that the situation has improved. If gathering data took longer than the current estimate, the estimate is increased correspondingly. If a service becomes sufficiently loaded (e.g., due to increase user activity) so that the observed data-gathering delay increases, MonAMI will adjust its estimate to match.
If data-gathering takes less time than the current estimated value, the current estimate is not automatically decreased. Instead, MonAMI waits to see if the lower value is reliable, and that the delay has stabilised at the lower value. Once it is reasonably sure of this, MonAMI will reduce its estimate for future data-gathering delays.
To determine when the delay has stabilised, MonAMI keeps a history of previous data-gathering delay values. The history is stored as several discrete intervals, each with the same minimum duration. By default, there are ten history intervals each with a one minute minimum duration, giving MonAMI a view of recent history going back at least ten minutes.
Each interval has only one associated value: the maximum observed delay during that interval. At all times, there is an interval called the current interval. Only the current interval is updated, the other intervals provide historical context. As data is gathered the maximum observed delay for the current interval is updated.
When the current interval has existed for more than the minimum duration (one minute, by default), all the intervals moved: the current history interval becomes the first non-current history interval, what was the first non-current interval becomes the second, and so on. The information in the last history interval is dropped and a new current interval is created. Future data-gathering delays are recorded in this new current interval until the minimum interval has elapsed and the intervals moved again.
MonAMI takes two statistical measures of the history intervals: the maximum value and the average absolute deviation (or average deviation for short). The maximum value is the proposed new value for the estimated delay, if it is lower, and the absolute deviation is used to determine if the change is significant.
Broadly speaking, the average deviation describes how settled the data stored in the historic intervals are over the recent history: a low number implies data-taking delays are more predictable, a high number indicates they are less predicable. MonAMI only reduces the estimate for future delays if the difference (between current estimate value and the maximum over all historic intervals) is significant. It is significant if the ratio between the proposed drop in delay and the average deviation exceeds a certain threshold value.
In summary, to reduce the estimate of future delays, the observed delay must be persistently low over the recorded history (minimum of 10 minutes, by default). If the delay is temporarily low, is decreasing over time or fluctuates, the estimate is not reduced.
There are two attributes that affect how MonAMI determines
its estimate. The default values should be sufficient under
most circumstances. Moreover, there are separate attributes
for adjusting the behaviour both of adaptive monitoring (see
Section 3.6.5, “Sample attributes”), and the
dmax value of Ganglia (see Section 3.5.3, “Attributes”). Adjusting these attributes
may be more appropriate.
Attributes
- md_intervals integer, optional
the number of historic intervals to consider. The default is 10 and the value must be between 2 and 30. Increased number of intervals results in more stringent requirement needed before the estimate is reduced. It also increases the accuracy of the average deviation measurements.
Having a small number of intervals (less then 5, say) is not recommended as the statistics becomes less reliable.
A large number of intervals gives more reliable statistical results, but the system will take longer to react (to reduce the delay estimate) to changing situations. Perhaps this is most noticeable if there is a single data-gathering delay that is unusually long. If this happens, MonAMI will take at least the md_intervals times the minimum delay to reduce the delay estimate.
- md_duration integer, optional
The minimum duration, in seconds, for an interval. The default is 60 seconds and the value must be between 1 second and 1200 seconds (20 minutes).
Each interval must have at least one data point: an observation of the data-gathering delay. To ensure this, the value of md_duration is implemented as a minimum duration and, in practise, the intervals can be longer. For example, with the default configuration (md_duration of one minute, md_intervals of 10) if only a single monitoring flow is established that gathers data from a monitoring target every 90 seconds, each interval will have a 90 second duration and complete history will be 15 minute.
This section describes the different services that can be monitored (for example, a MySQL database or an Apache webserver). It gives brief introductions to which services the plugins can monitor and how they can be configured. Wherever possible, sensible defaults are available so often little or no configuration is required for common deployment scenarios.
The available monitoring plugins depend on which plugins have been built and installed. If you have received this document as part of a binary distribution, it is possible that the distribution does not include all the plugins described here. It might also contain other plugins provided independently from the main MonAMI release.
AMGA (ARDA Metadata Catalogue Project) is a metadata server provided by the ARDA/EGEE project as part of their gLite software releases. It provides additional metadata functionality by wrapping an underlying database storage. More information about AMGA is available from the AMGA project page.
The amga monitoring plugin will monitor the server's database connection usage and the number of incoming connections. For both, the current value and configured maximum permitted are monitored.
Attributes
- host string, optional
the host on which the AMGA server is running. The default value is
localhost.- port integer, optional
the port on which the AMGA server listens. The default value is 8822.
The Apache HTTP (or web) server is perhaps the most well known project from the Apache Software Foundation. Since April 1996, the Netcraft web survey has shown it to be the most popular on the Internet. More details can be found at the Apache home page.
The apache plugin monitors the current status of an Apache HTTP server. It can also provide event-based monitoring, based on various log files.
The Apache server monitoring is achieved by downloading the
server-status page (provided by the mod_status Apache plugin) and
parsing the output. Usually, this option is available within the
Apache configuration, but commented-out by default (depending on
the distribution). The location of the Apache configuration is
Apache-version and OS specific, but is usually found in either the
/etc/apache, /etc/apache2 or /etc/httpd directory. To enable the
server-status page, uncomment the section or add lines within the
apache configuration that look like:
<Location /server-status>
    SetHandler server-status
    Order deny,allow
    Deny from all
    Allow from .example.com
</Location>
Here .example.com is an illustration of how to limit
access to this page. You should change this to either your DNS
domain or explicitly to the machine on which you are to run
MonAMI.
There is an ExtendedStatus option that configures Apache to include some additional information. This is controlled within the Apache configuration by lines similar to:
<IfModule mod_status.c>
  ExtendedStatus On
</IfModule>
Switching on the extended status should not greatly affect the server's load and provides some additional information. MonAMI can understand this extra information, so it is recommended to switch on this ExtendedStatus option.
Event-based monitoring
Event-based monitoring is made available by watching log files. Any time the Apache server writes to a watched log file, an event is generated. The plugin supports multiple event channels, allowing support for multi-homed servers that log events to different log files.
Event channels are specified by log attributes. This can be repeated to configure multiple event channels. Each log attribute has a corresponding value like:
name:path[type]
where:
nameis an arbitrary name given to this channel. It cannot have a colon (
:) and should not have a dot (.) but most names are valid.pathis the path to the file. Log rotations (where a log file is archived and a new one created) are supported.
typeis either
combined, orerror.
The following example configures the access
channel to read the log file
/var/log/apache2/access.log, which is in the
Apache standard “combined” format.
[apache]
 log = access: /var/log/apache2/access.log [combined]
Attributes
- host string, optional
the hostname for webserver to monitor. The default value is
localhost.- port integer, optional
the port on which the webserver listens. The default value is 80
- log string, zero or more
specifies an event monitoring channel. Each log attribute has a value like:
name:path[type]
dCache (see dCache home page) is a system jointly developed by Deutsches Elektronen-Synchrotron (DESY) and Fermilab that aims to provide a mechanism for storing and retrieving huge amounts of data among a large number of heterogeneous server nodes, which can be of varying architectures (x86, ia32, ia64). It provides a single namespace view of all of the files that it manages and allows access to these files using a variety of protocols, including SRM, GridFTP, dCap and xroot. By connecting dCache to a tape storage backend, it becomes a hierarchical storage manager (HSM).
Authentication
The dCache monitoring plugin works by connecting to the underlying PostGreSQL database that dCache uses to store the current system state. To achieve this, MonAMI must have the credentials (a username and password) to log into the database and perform read queries.
If you do not already have a read-only account, you will need to create such an account. It is strongly recommended not to use an account with any write privileges as the password will be stored plain-text within the MonAMI configuration file (see Section 4.2.2, “Passwords being stored insecurely”).
To configure PostGreSQL, SQL commands need to be sent to the database server. To achieve this, you will need to use the psql command, connecting to the dcache database. On many systems you must log in as the database user “postgres”, which often has no password when connecting from the same machine on which database server is running. A suitable command is:
psql -U postgres -d dcache
The following SQL commands will create an account
monamimonami-secret
Important
Please ensure you change the example password
(monami-secret
CREATE USERmonami; ALTER USERmonamiPASSWORD 'monami-secret'; GRANT SELECT ON TABLE copyfilerequests_b TOmonami; GRANT SELECT ON TABLE getfilerequests_b TOmonami; GRANT SELECT ON TABLE putfilerequests_b TOmonami;
If you intend to monitor the database remotely, you may need to
add an extra entry in PostGreSQL's remote access file:
pg_hba.conf. With some distribution, this
file is located in the directory
/var/lib/pgsql/data.
Currently, the information gathered is limited to the rate of SRM
GET, PUT and COPY requests received. This information is gathered
from the copyfilerequests_b,
getfilerequests_b and putfilerequests_b tables. Future
versions of MonAMI may read other tables, so requiring additional
GRANT statements.
Attributes
- host string, optional
the host on which the PostGreSQL database is running. The default is
localhost.- ipaddr string, optional
the IP address of the host on which the database is running. This is useful when the host is on multiple IP subnets and a specific one must be used. The default is to look up the IP address from the host.
- port integer, optional
the
TCPport to use when connecting to the database. The default is port 5432 (the standard PostGreSQL port).- user string, optional
the username to use when connecting to the database. The default is the username of the system account MonAMI is running under. When running as a daemon from a standard RPM-based installation, the default user will be
monami.- password string, optional
the password to use when authenticating. The default is to attempt password-less login to the database.
Disk Pool Manager (DPM) is a service that implements the SRM protocol (mainly for remote access) and rfio protocol (for site-local access). It is an easy-to-deploy solution that can support multiple disk servers but has no support for tape/mass-storage systems. More information on DPM can be found at the DPM home page.

The dpm plugin connects to the MySQL server DPM uses. By querying this database, information is extracted such as the status of the filesystems and the used and available space. The space statistics are available as a summary, and broken down for each group, and for each filesystem. The daemon activity on the head node can also be monitored.
Authentication
This plugin requires read-only privileges for the database DPM
uses. The following set of SQL statements creates login
credentials with username of
monamiusermonamipass
GRANT SELECT ON cns_db.* TO 'monamiuser'@'localhost'
                IDENTIFIED BY 'monamipass';
GRANT SELECT ON dpm_db.* TO 'monamiuser'@'localhost'
                IDENTIFIED BY 'monamipass';
If MonAMI is to monitor the MySQL database remotely, the following SQL can be used to create login credentials
GRANT SELECT ON cns_db.* TO 'monamiuser'@'%'
                IDENTIFIED BY 'monamipass';
GRANT SELECT ON dpm_db.* TO 'monamiuser'@'%'
                IDENTIFIED BY 'monamipass';
If local and remote access to the MonAMI database is needed all four above SQL commands should be combined.
Attributes
- host string, optional
the host on which the MySQL server is running. Default is
localhost.- user string, required
the username with which to log into the server.
- password string, required
the password with which to log into the server.
The filesystem plugin monitors generic (i.e., non-filesystem specific) features of a mounted filesystem. It reports both capacity and “file” statistics. The “file” statistics correspond to inode usage for filesystems that use inodes (such as ext2).
Note
With both reported resources (blocks and files), there are similar-sounding metrics: “free” and “available”. “free” refers to total resource potentially available and “available” refers to the resource available to general (non-root) users.
The difference between the two comes about because it is common to reserve some capacity for the root user. This allows core system services to continue when a partition is full: normal users cannot create files but root (and processes running as root) can.
Attributes
- location string, required
the absolute path to any file on the filesystem.
The Globus Alliance distribute a modified version of the WU-FTP client that has been patched to allow GSI-based authentication and multiple streams. This is often referred to as “GridFTP”.
Various grid components use GridFTP as an underlying transfer mechanism. Often, these have the same log-file format for recording transfers, so parsing this log-file is a common requirement.
The gridftp plugin monitors GridFTP log files, providing an event for each transfer. This is under the transfers channel.
Attributes
- filename string, required
the absolute path to the GridFTP log file.
On their website, Cluster Resources describe Maui as “an advanced batch scheduler with a large feature set well suited for high performance computing (HPC) platforms”. Within a cluster it is used to decide which job (of many that are available) should be run next. Maui provides sophisticated scheduling features such as advanced fair-share definitions and “allocation bank”. More details are available within the Maui homepage.
Access control
The MonAMI maui plugin will need sufficient access rights
to query the Maui server. If MonAMI is running on the same
machine as the Maui server, (most likely) no additional host will
be needed. If MonAMI is running on a remote machine, then
access-right must be granted for that machine. Append the remote
host's hostname to the space-separated ADMINHOST
list.
The plugin will also need to use a valid username. By default it
will use the name of the user it is running as (monami),
but the plugin can use an alternative username (see the
user attribute). To add an additional
username, append the username to the space-separated
ADMIN3 list.
The following example configuration shows how to configure Maui to
allow monitoring from host
monami.example.orgmonami
SERVERHOST maui-server.example.org ADMIN1 root ADMIN3monamiADMINHOST maui-server.example.orgmonami.example.orgRMCFG[base] TYPE=PBS SERVERPORT 40559 SERVERMODE NORMAL
Password
The Maui authenticates by the client and server keeping a shared secret: a password. Currently this password must be integer number. Unfortunately, the password is decided as part of the Maui build process. If one is not explicitly specified, a random number is selected as the password. The password is then embedded within the Maui client programs and used when they communicate with the Maui server. Currently, it is not possible to configure the Maui server to use an alternative password without rebuilding the Maui client and servers.
To communicate with the Maui server the maui plugin must know the password. Unfortunately, as the password is only stored within the executables, it is difficult to discover. The maui plugin has heuristics that allow it to scan a Maui client program and, in most cases, discover the password. This requires a Maui client program to be present on whichever computer MonAMI is running. If the Maui client is in a non-standard location, its absolute path can be specified with the exec attribute.
If the password is known (for example, its value was specified when compiling Maui) then it can be specified using the password attribute. Specifying the password attribute will stop MonAMI from scanning Maui client programs.
Once the password is known, it can be stored in the MonAMI configuration using the password attribute. This removes the need for a Maui client program. However, should the Maui binaries change (for example, upgrading an installed Maui package), it is likely that the password will also change. This would stop the MonAMI plugin from working until the new password was supplied.
The recommended deployment strategy is to install MonAMI on the Maui server and allow the maui plugin to scan the Maui client programs for the required password.
Time synchronisation
When communicating between the maui and Maui server, both parties want to know that the messages are really from the other party. The shared-secret is one part of this process, another is to check the time within the message. This is to prevent a malicious third-party from sending messages that have already been sent: a “replay attack”.
To prevent these replay attacks, the clocks on the Maui server and the server MonAMI is running must agree. If both machines are well configured, their clocks will agree with ~10 millisecond difference. Since the network may introduce a slight delay, some tolerance is needed.
The maui plugin requires an agreement of one second by default. This should be easy to satisfied with modern networks. If, for whatever reason, this is not possible the tolerance can be make more lax by specifying the max_time_delta attribute.
Note
Should there be a systematic error between the clocks on two servers, effort should be made in synchronosing those clocks. Increasing the max_time_delta makes MonAMI more vulnerable to replay attacks.
Attributes
- host string, optional
the hostname of the Maui server. If not specified,
localhostwill be used.- port integer, optional
the
TCPport to which the plugin with connect. If not specified, the default value is 40559.- user string, optional
the user name to present to the Maui server when communicating. The default value is the name of the account under which MonAMI is running.
- max_time_delta integer, optional
the maximum allowed time difference, in seconds, between the server and client. The default value is one second.
- password integer, optional
the shared-secret between this plugin and the Maui server. The default policy is to attempt to discover the password automatically. Specifying the password will prevent attempts at discovering it automatically.
- timeout string, optional
the time MonAMI should wait for a reply. The string is in time-interval format (e.g., “
5m
	  10s
” is five minutes and ten seconds; “310” would be equivalent). The default behaviour is to wait indefinitely.- exec string, optional
the absolute path to the mclient (or similar) Maui client program. If the plugin was unsuccessful scanning the program given by
execit will also try standard locations.
This plugin monitors the performance of a MySQL database. MySQL is a commonly used Free (GPLed) database. The parent company (MySQL AB) describe it as “the world's most popular open source database”. For more information, please see the MySQL home page
The statistics monitored are taken from the status variables.
They are acquired by executing the MySQL SQL SHOW
STATUS;. The raw variables are described in the MySQL
manual, section 5.2.5: Status
Variables.
Note
The metrics names provided by MySQL are in a flat namespace. These names are not used by MonAMI; instead, the metrics are mapped into a tree structure, allowing more easy navigation of, and section from, the available metrics.
Privileges
To function, this plugin requires an account to access the
database. Please note: this database account requires no database
access privileges, only that the username and password will allow
MonAMI to connect to the MySQL database. For security
considerations, you should not employ login
credentials used elsewhere (and never root or similar
power-user). The following is a suitable SQL statement for
creating a username and password of
monamimonamipass
CREATE USER 'monami'@'localhost' IDENTIFIED BY "monamipass";
Sharing login credentials is not recommended. If you decide to
share credentials make sure the MonAMI configuration file is
readable only by the monami user (see Section 3.2.2, “Dropping root
privileges”).
Note
In addition to monitoring a MySQL database, the mysql plugin can also store information MonAMI has gathered within MySQL. This is described in Section 3.5.8, “MySQL”.
Attributes
- user string, required
the username with which to log into the server.
- password string, required
the password with which to log into the server
- host string, optional
the host on which the MySQL server is running. If no host is specified, the default
localhostis used.
The null plugin is perhaps the simplest to understand. As a monitoring plugin, it providing an empty datatree when requested for data. The main use for null as a monitoring target is to demonstrating aspects of MonAMI without the distraction of real-life effects from other monitoring plugins.
The null plugin will supply an empty datatree. In conjunction with a reporting plugin (e.g., the snapshot), this can be used to demonstrate the map attribute for adding static content. This attribute is described in Section 3.3.3, “The map attribute”.
Delays
Another use for a null target is to investigate the effect of a service taking a variable length of time to respond with monitoring data. This is emulated by specifying a delay file. If the delayfile attribute is set, then the corresponding file is read. It should contain a single integer number. This number dictates how long (in seconds) a null target should wait when requested for data. The file can be changed at any time and the change will affect the next time the null target is read from. This is particularly useful for demonstrating how MonAMI estimates future delays (see Section 3.3.4, “Estimating future data-gathering delays”) and undertakes adaptive monitoring (see Section 3.6.4, “Adaptive monitoring”).
The following example will demonstrate this usage:
[null]
 delayfile=/tmp/monami-delay

[sample]
 read = null
 write = null
 interval = 1s
Then, by changing the number stored in
/tmp/monami-delay, the delay can be adjusted
dynamically. To set the delay to three seconds, do:
$ echo 3 > /tmp/monami-delay
To remove the delay, simply set the delay to zero:
$ echo 0 > /tmp/monami-delay
Attributes
- delayfile string, optional
the filename of the delay file, the contents of which is parsed as an integer number. This number is the number of seconds the null target will delay when replying with an empty datatree.
Network UPS Tools (NUT) provides a standard method through which an Uninterruptable Power Supply (UPS) can be monitored. Part of this framework allows for signalling, so that machines can undergo a controlled shutdown in the event of a power failure. Further details of NUT are available from the NUT home page.
The MonAMI nut plugin connects to the NUT data
aggregator daemon (upsd) and queries the status of all known,
attached UPS devices. The ups.conf file must
be configured for available hardware and the startup scripts must
be configured to start the required UPS-specific monitoring
daemons.
By default, localhost will be allowed access to the upsd
daemon but access for external hosts must be added explicitly in
the upsd.conf file. See the NUT
documentation on how best to achieve this.
Attributes
- host string, optional
the host on which the NUT
upsddaemon is running. The default value islocalhost.- port integer, optional
the port on which the NUT
upsddaemon listens. The default value is 3493.
The process plugin monitors Unix processes. It can count the number of processes that match search criteria and can give detailed information on a specific process.
The information process gives should not be confused with any process, memory or thread statistics other monitoring plugins provide. Some services report their current thread, process or memory usage, which may duplicate some of the information this plugin reports (see, for example, Section 3.4.2, “Apache” and Section 3.4.8, “MySQL”). However, process reports information from the kernel and should work with any application.
The process plugin has two main types of monitors: counting processes and detailed information about a single process. A single process target can be configured to do any number of either type of monitoring and the results are combined in the resulting datatree.
Counting processes
To count the number of processes, a count
attribute must be specified. In its simplest form, the
count attribute value is simply the name of
the process to count. The following example reports the number of
imapd processes that are currently in existance.
[process]
 count = imapd
The format of the count attribute allows
for more sophisticated queries of form:
reported name :
    proc name
    [cond1,
    cond2, ...]
All of the parts are optional: the part upto and including the
colon
(reported name :proc name[) can be omitted, but
at least one of the first two parts must be specified. The
examples below may help clarify this!
cond1,
cond2, ...]
To be included in the count, a process' name must match the
proc namereported nameproc name
The part in square brackets, if present, specifies some additional
constraints. The comma-separated list of key, value pairs define
additional predicates; for example, [uid=root,
state=R] means only processes that are running as
root and are in state running will be counted. The valid
conditions are:
uid =uidto be considered, the process must be running with a user ID of
uidgid =gidthe process must be running with a group ID of
gidstate =statelistthe process must have one of the states listed in
statelistRprocess is running (or ready to be run),
Ssleeping, awaiting some external event,
Din uninterruptable sleep (typically waiting for disk IO to complete),
Tstopped (due to being traced),
Wpaging,
Xdead,
Zdefunct (or "zombie" state).
The following example illustrates count used to count the number of processes. The different attributes show how the different criteria are represented.
[process] count = imapd ❶ count = io_imapd : imapd [state=D] ❷ count = all_java : java ❸ count = tomcat_java : java [uid=tomcat5] ❹ count = zombies : [state=Z] ❺ count = tcat_z : java [uid=tomcat4, state=Z] ❻ count = run_as_root : [uid=0] ❼
Count the number of | |
Count the number of | |
Count the number of java processes that
are running. Store the number as a metric called
| |
Count the number of java processes that
are running as user | |
Count the total number of zombie processes. Store the
number as a metric called | |
Count the number of zombie tomcat
processes. Store the number as a metric called
| |
Count the number of processes running as |
Detailed information
The watch attribute specifies a process to monitor in detail. The process to watch is identified using the same format as with count statements; however, the expectation is that only a single process will match the criteria.
If there is more than one process matching the search criteria then one is chosen and that process is reported. In principle, the selected process might change from one time to the next, which would lead to confusing results. In practise, the process with the lowest pid is chosen, so is both likely to be the oldest process and unlikely to change over time. However, this behaviour is not guaranteed.
Much information is gathered with a watch
attribute. This information is documented in the
stat and status sections
of the proc(5) manual page. Some of the
more useful entries are copied below:
- pid
the process ID the the process being monitored.
- ppid
the process ID of the parent process.
- state
a single character, with the same semantics as the different process states listed above.
- minflt
number of minor memory page faults (no disk swap activity was required).
- majflt
number of major memory page faults (those requiring disk swap activity).
- utime
number of jiffies[1] of time spent with this process scheduled in user-mode.
- stime
number of jiffies[1] of time spent with this process scheduled in kernel-mode.
- threads
number of threads in use by this process.
Note
An accurate value is provided by the 2.6-series kernels. Under 2.4-series kernel with LinuxThreads, heuristics are used to derive a value. This value should be correct under most circumstances, but it may be confused if multiple instances of the same multi-threaded process is running concurrently.
- vsize
virtual memory size: total memory used by the process.
- rss
Resident Set Size: number of pages of physical memory a process is using (less 3 for administrative bookkeeping).
Attributes
- count string, optional
either the name of the process(es) to count, or the conditions processes must satisfy to be included in the count. This attribute may be repeated for multiple process counting.
count attributes have the form:
reported name:proc name[cond1,cond2, ...]- watch string, optional
either the name of the process to obtain detailed information, or the conditions a process must satisfy to be watched. This attribute may be repeated to obtain detailed information about multiple processes.
watch attributes have the form:
reported name:proc name[cond1,cond2, ...]
The stocks plugin uses one of the web-services provided by XMethods to obtain a near real-time quote (delayed by 20 minutes) for one or more stocks on the United States Stock market. Further details of this service are available from the Stocks service summary page.
In addition to providing financial information, stocks is
a pedagogical example that demonstrates the use of SOAP within
MonAMI.
Caution
The authors of MonAMI expressly disclaim the accuracy, adequacy, or completeness of any data and shall not be liable for any errors, omissions or other defects in, delays or interruptions in such data, or for any actions taken in reliance thereon.
Please do not send too many requests. A request every couple of minutes should be sufficient.
Attributes
- symbols string, required
a comma- (or space-) separated list of ticker symbols to monitor. For example,
GOOGis the symbol for Google Inc. andRHTis the symbol for RedHat Inc.
The tcp monitoring plugin provides information about the
number of TCP sockets in a particular state. Here, a socket is
either a TCP connection to some machine or the ability to
receive a particular connection (i.e., that the local machine is
“listening” for incoming connections).
A tcp monitoring target takes an arbitrary number of
count attributes. The value of a
count attributes describes how to report
the number of matching sockets and the criteria for including a
socket within that count. These attributes take values like:
name
[cond1,
cond2, ...]nameTCP sockets. The conditions
(cond1cond2state=ESTABLISHED). A socket must match all
conditions to be included in the count.
The condition keywords may be any of the following:
local_addrThe local
IPaddress to which the socket is bound. This may be useful on multi-homed machines for sockets bound to a single interface.remote_addrThe remote
IPaddress of the socket, if connected.local_portThe port on the local machine. This can be the numerical value or a common name for the port, as defined in
/etc/service.remote_portThe port on the remote machine, if connected. This can be the numerical value or a common name for the port.
portA socket's local or remote port must match. This can be the numerical value or a common name for the port.
stateThe current state of the socket. Each local socket will be in one of a number of states and changes state during the lifetime of a connection. All the states listed below are valid and may occur naturally on a working system; however, under normal circumstances some states are transitory: one would not expect a socket to stay in a transitory state for long. A large and/or increasing number of sockets in one of these transitory states might indicate a networking problem somewhere.
The valid states are listed below. For each state, a brief description is given and the possible subsequent states are listed.
- LISTEN
A program has indicated it will receive connections from remote sites.
Next: SYN_RECV, SYN_SENT
- SYN_SENT
Either a program on the local machine is the client and is attempting to connect to remote machine, or the local machine sends data from a LISTENing socket (less likely).
Next: ESTABLISHED, SYN_RECV or CLOSED
- SYN_RECV
Either a LISTENing socket has received an incoming request to establish a connection, or both the local and remote machines are attempting to connect at the same time (less likely)
Next: ESTABLISHED, FIN_WAIT_1 or CLOSED
- ESTABLISHED
Data can be sent to/from local and remote site.
Next: FIN_WAIT_1 or CLOSE_WAIT
- FIN_WAIT_1
Start of an active close. The application on local machine has closed the connection. Indication of this has been sent to the remote machine.
Next: FIN_WAIT_2, CLOSING or TIME_WAIT
- FIN_WAIT_2
Remote machine has acknowledged that local application has closed the connection.
Next: TIME_WAIT
- CLOSING
Both local and remote applications have closed their connections “simultaneously”, but remote machine has not yet acknowledged that the local application has closed the local connection.
Next: TIME_WAIT
- TIME_WAIT
Local connection is closed and we know the remote site knows this. We know the remote site's connection is closed, but we don't know if the remote site know that we know this. (It is possible that the last ACK packet was lost and, after a timeout, the remote site will retransmit the final FIN packet.)
To prevent the potential packet loss (of the local machine's final ACK) from accidentally closing a fresh connection, the socket will stay in this state for twice MSL timeout (depending on implementation, a minute or so).
Next: CLOSED
- CLOSE_WAIT
The start of a passive close. The application on the remote machine has closed its end of the connection. The local application has not yet closed this end of the connection.
Next: LASK_ACK
- LASK_ACK
Local application has closed its end of the connection. This has been sent to the remote machine but the remote machine has not yet acknowledged this.
Next: CLOSED
- CLOSED
The socket is not in use.
Next: LISTEN or SYN_SENT
- CONNECTING
A pseudo state. The transitory states when starting a connection match, specifically either SYN_SENT or SYN_RECV.
- DISCONNECTING
A pseudo state. The transitory states when shutting down a connection match, specifically any of FIN_WAIT_1, FIN_WAIT_2, CLOSING, TIME_WAIT, CLOSE_WAIT or LASK_ACK match.
The states ESTABLISHED and LISTEN are long-lived states. It is natural to find sockets that are in these states for extended periods.
For applications that use “half-closed” connections, the FIN_WAIT_2 and TIME_WAIT states are less transitory. As the name suggests, half-closed connections allows data to flow in one direction only. It is achieved by the application that no longer wishes to send data closing their connection (see FIN_WAIT_1 above), whilst the application wishing to continue sending data does nothing (and so suffers a passive close). Once the half-closed connection is established, the active close socket (which can no longer send data) will be in FIN_WAIT_2, whilst the passive close socket (which can still send data) will be in CLOSE_WAIT.
There are two pseudo states for the normal transitory states: CONNECTING and DISCONNECTING. They are intended to help catch networking or software problems.
The following example checks whether an application is listening on three well-known port numbers. This might be used as a check whether services are running as expected.
[tcp]
  name = listening
  count = ssh          [local_port=ssh, state=LISTEN]
  count = ftp          [port=ftp, state=LISTEN]
  count = mysql        [local_port=mysql, state=LISTEN]
The following example records the number of connections to a
webserver. The established metric records the
connections where data may flow in either direction. The other
two metrics record connections in the two pseudo states. Normal
traffic should not stay long in these pseudo states; connections
that persist in these states may be symptomatic of some problem.
[tcp]
  name = incoming_web_con
  count = established   [local_port=80, state=ESTABLISHED]
  count = connecting    [local_port=80, state=CONNECTING]
  count = disconnecting [local_port=80, state=DISCONNECTING]
Attributes
- count string, optional
the name to report for this metric followed by square brackets containing a comma-separated list of conditions a socket must satisfy to be included in the count. This option may be repeated for multiple
TCPconnection counts.The conditions are keyword-value pairs, separated by
=, with the following valid keywords:local_addr,remote_addr,local_port,remote_port,port,state.The
statekeyword can have one of the followingTCPstates: LISTEN, SYN_RECV, SYN_SENT, ESTABLISHED, CLOSED, FIN_WAIT_1, FIN_WAIT_2, CLOSE_WAIT, CLOSING, TIME_WAIT, LASK_ACK; or one of the following two pseudo states: CONNECTING, DISCONNECTING.
Apache Tomcat is one of the projects from the Apache Software
Foundation. It is a Java-based application server (or servlet
container) based on Java Servlet and JavaServer Pages
technologies. Servlets and JSP are defined under Sun's Java
Community Process. More information about Tomcat can be found
at the Apache
Tomcat home page.
Also under development of the Java Community Process is the Java
Monitoring eXtensions (JMX). JMX provides a standard method
of instrumenting servlets and JSPs, allowing remote monitoring
and control of Java applications and servlets.
The tomcat plugin uses the JMX-proxy servlet to monitor
(potentially) arbitrary aspects of a Servlet and JSPs. This
provides structured plain-text output from Tomcat's JMX MBean
interface. Applications that require monitoring should connect to
that interface for MonAMI to discover their data.
To monitor a custom servlet, the required instrumentation within
the servlet/JSP must be written. Currently, there is an
additional light-weight conversion needed within MonAMI, adding
some extra information about the monitored data. Sample code
exists that monitors aspects of the Tomcat server itself.
Any tomcat monitoring target will need a username and
password that matches a valid account within the Tomcat server
that has the manager
role. This is normally configured in the file
$CATALINA_HOME/conf/tomcat-users.xml.
Including the following line within this file creates a new user
monami, with password
monami-secretmanager role, to
Tomcat.
<user username="monami" password="monami-secret" roles="manager"/>
This line should be added within the
<tomcat-users> context.
Warning
Be aware that Basic authentication sends the username and password unencrypted over the network. These values are at risk if packets can be captured. If you are not sure, you should run MonAMI on the same server as Tomcat.
In addition to connecting to Tomcat, you also need to specify which classes of information you wish to monitor. The following are available: ThreadPool and Connector. To monitor some aspect, you must specify the object type along with the identifier for that object within the monitoring definition. For example:
[tomcat]
 name = local-tomcat
 ThreadPool = http-8080
 Connector = 8080
ThreadPool monitors a named thread pool (e.g.,
http-8080), monitoring the following
quantities:
- minSpareThreads
the minimum number of threads the server will maintain.
- currentThreadsBusy
the number of threads that are either actively processing a request or waiting for input.
- currentThreadCount
total number of threads within this ThreadPool.
- maxSpareThreads
if the number of spare threads exceeds this value, the excess are deleted.
- maxThreads
an absolute maximum number of threads.
- threadPriority
the priority at which the threads run.
The Connector monitors a ConnectorMBean and is identified by which port it listens on. It monitors the following quantities:
- allowTrace
Can we trace the output?
- clientAuth
Did the client authenticate?
- compression
Is the connection compressed?
- disableUploadTimeout
Is the upload timeout disabled?
- emptySessionPath
Is there no session?
- enableLookups
Are lookups enabled?
- tcpNoDelay
Is the
TCPSO_NODELAYflag set?- useBodyEncodingForURI
does the
URIcontain body information?- secure
are the connections secure?
- acceptCount
number of pending connections this Connector will accept before rejecting incoming connections.
- bufferSize
size of the input buffer.
- connectionLinger
how long the connection lingers, waiting for other connections.
- connectionTimeout
the timeout for this connection.
- connectionUploadTimeout
the timeout for uploads.
- maxHttpHeaderSize
the maximum size for
HTTPheader.- maxKeepAliveRequests
how many keep-alives before the connection is considered dead.
- maxPostSize
maximum size of the information
POSTed.- maxSpareThreads
c.f. ThreadPool
- maxThreads
c.f. ThreadPool
- minSpareThreads
c.f. ThreadPool
- threadPriority
c.f. ThreadPool
- port
the port on which this connector listens.
- poxyPort
the proxy port associated with this connector.
- redirectPort
the port to which this connector will redirect.
- protocol
which protocol the connector uses (e.g.,
HTTP/1.1)- sslProtocol
the
SSLprotocol the connector uses (e.g.,TLS)- scheme
which scheme the
URIwill use (e.g.,http,https)
Attributes
The tomcat monitoring target accepts the following options:
- host string, optional
the hostname of the machine to monitor. The default value is
localhost.- port integer, optional
the
TCPport on which Tomcat listens. The default value is 8080- jmxpath string, optional
the path to the
JMX-proxy servlet within the application serverURInamespace. The default path is/manager/jmxproxy/- username string, optional
the username to use when completing Basic authentication.
- password string, optional
the password to use when completing Basic authentication.
The Torque homepage describes Torque as “an open source resource manager providing control over batch jobs and distributed compute nodes.” Torque was based on the original PBS/Open-PBS project, but incorporates many new features. It is now a widely used batch control system.
Torque is heavily influenced by the IEEE 1003.1 specification,
in particular Section
3 (Batch Evironment Services) of the Shell
& Utilities volume. However, it also includes some additional
features, such as support for jobs in the suspended state.
Access control
Torque uses username-and-host based authorisation. Users may query the status of their own jobs, but may require special privileges to view the status of all jobs. Because of this, the MonAMI torque plugin may require authorisation to gather monitoring information.
To grant torque sufficient privileges to conduct its
monitoring, the Torque server must have either
query_other_jobs set to True
(allowing all users to see other user's job information) or have
the MonAMI user (typically monami) and host added as one of
the operators. Setting either option is
sufficient and both can be achieved using the
qmgr command.
The command qmgr -ac "list server
query_other_jobs" will display the current value of
query_other_jobs. To allow all users to see
other user's job status, run the command: qmgr -ac "set
server query_other_jobs = True".
The command qmgr -ac "list server operators"
will display the current list of operators. To add user
monami running on host mon-hq.example.org as another
operator, use the command qmgr -ac "set server operators
+=
.
monami@mon-hq.example.org"
Queue groups
It is often useful to group together multiple execution queues when generating statistics. The group may represent queues with a similar purpose, or the group represents a set of queues that support a wider community. MonAMI supports this by allowing the definition of queue-groups and will report statistics for each of these groups.
A queue-group is defined by including a group attribute in the torque target. Multiple groups can be defined by repeating the group attributes, one attribute for each group.
A group attribute's value defines the group
like: name :
queue1,
queue2, ...namequeue1queue2
As an example, the following torque stanza defines four
groups: HEP, LHC,
Grid OPS, and Local.
[torque]
  group = HEP      : alice, atlas, babar, dzero, lhcb, cms, zeus
  group = LHC      : atlas, lhcb, cms, alice
  group = Grid OPS : dteam, ops
  group = Local    : biomed, carmont, glbio, glee
Attributes
- host string, optional
the hostname of the Torque server. If not specified, a default value will be used, which is specified externally to MonAMI. This default may be
localhostor may be configured to whatever is the most appropriate Torque server.- group string, optional
defines a new queue-group that statistics are collected against. The group value is like:
name:queue1,queue2, ...
The Varnish home
page describes Varnish as a
“state-of-the-art, high-performance HTTP
accelerator. Varnish is targeted primarily at the FreeBSD 6/7
and Linux 2.6 platforms, and takes full advantage of the virtual
memory system and advanced I/O features offered by these operating
systems.”
Varnish offers a management interface. The MonAMI varnish plugin connects to this this interface and request the server's current set of statistics.
Attributes
- host string, optional
the host on which Varnish is running. Default is
localhost.- port integer, optional
the
TCPport on which the Varnish management interface is listening. The default value is 6082.
Information needs to go somewhere for it to be useful. MonAMI's job is to take data from one or more monitoring targets and send it somewhere or (more often) to multiple destinations. Reporting plugins deal with “sending data somewhere” and the reporting targets are configured reporting plugins to which data can be sent.
As with monitoring targets, all reporting targets need a unique name. By default a reporting target will adopt the plugin's name. As with monitoring targets, it is recommended to set a unique, meaningful name for each reporting target in complex configurations.
The filelog plugin stores information within a file. The
file format is deliberately similar to standard log files, as
found in the /var/log filesystem hierarchy.
New data is appended to the end of the file. Fields are separated
by tab characters and each line is prefixed by the date and time
when the data was taken.
If the file does not exist, it is created. When the file is
created, a header line is added before any data. This line starts
with the hash (#) symbol, indicating that the line
does not contain data. The header consists of a tab-separated
list of headings for the data. This list is correct for the first
row of data. If the data is aggregated from multiple monitoring
targets, then the order of those targets is not guaranteed.
Attributes
- filename string, required
the full path of the file into which data will be stored.
The FluidSynth project provides code (a library and a program) that accepts MIDI (a standard music interface) information and provides a MIDI-like API, providing high-quality audio output. The fluidsynth software is based on the SoundFont file format. Each SoundFont file contains sufficient information to reproduce the sound from one or more musical instruments. These SoundFont files might include instruments of an orchestra, special effects (e.g., explosions) or sounds taken from nature (e.g., thunder or a dog barking). More information about fluidsynth can be found on the fluidsynth home page.
The fluidsynth plugin renders information as sound. The presence of sound might indicate a problem, or the pitch of the note might indicate how hard some application is working.
To achieve sound, the plugin either connects to some fluidsynth program or uses the fluidsynth library API, depending on how it is configured. If the configuration specifies a host attribute, then the plugin will attempt to connect to the fluidsynth program running on that host. If no host attribute is specified, then the fluidsynth plugin will use the fluidsynth library to configure and start a new fluidsynth instance.
When running the embedded fluidsyth code, the plugin requires at
least one soundfont attribute. These attributes
describe where the SoundFont files are located. Each
soundfont attribute is a comma-separated list,
specifying the short name for that file (used for the
note attributes) and the location of the SoundFont
file: short name ,
path to SoundFont file
An example soundfont attribute is:
soundfont = hi, /usr/share/SoundFonts/Hammered_Instruments.sf2
Using remote fluidsynth
When the plugin is connecting to a SoundFont program running independent of MonAMI, all soundfont attributes are ignored. Instead, all SoundFonts must be loaded independently of MonAMI. The easiest way of achieving this it to specify the SoundFont files as command-line options. For example:
fluidsynth -nis /usr/share/SoundFonts/Hammered_Instruments.sf2
Making sounds
The note attributes describe how sound is generated. The attribute has seven comma-separated values, like this:
note =sf,bank,pgm,note-range,duration,source,data-range
These attributes have the following meanings.
-
sf When no host attribute has been specified (i.e. using the fluidsynth library API), this is the short name for the SoundFont to use as described in soundfont attributes.
When connecting to a fluidsynth program, this is the (integer) number of the SoundFont to use. The first loaded SoundFont file is numbered 1.
-
bank This is the MIDI bank within the SoundFont to use. A MIDI bank is often a family of similar instruments. The available options will depend the loaded SoundFont files, but most SoundFonts will define instruments in bank 0.
-
pgm This is the MIDI program to use for this note. A program is a unique number for an instrument within a specified MIDI bank. General-MIDI defines certain programs to be named instruments, some SoundFonts follow General-MIDI for bank 0.
-
note-range This details which notes (pitches) might be played. For example,
note-range53if only a single note pitch is needed, or20-59to specify a range of notes. The range of notes must specify the lower note first.-
duration This is the duration of the note, in tenths of a second (or deciseconds). A
duration20results in a two-second note and5results in notes that last for half a second (500 ms).-
source This is the path in a datatree for the information. The metric can be an integer number, a floating-point number or a string.
If the metric is an integer or floating-point number then the metric value is used to decide whether the note should be played and if so, at which pitch.
If the metric has type string, then the metric's value is checked to see if a note should be played. For string metrics, the
note-range-
data-range This is the valid range of data that will produce a note.
If the metric has a string value, then the
data-rangeIf the metric has a numerical result, the
data-range0-10or10-0).Metric values in that range will cause a note to be played. The pitch of the note increases as the metric value tends towards the second number. With the
data-range0-10a metric value of 10 produces the highest pitch note; with thedata-range10-0a metric value of 0 produces the highest pitch note.Either number (or both) can be sufficed by a caret symbol (
^) indicating that numbers outside the range should be truncated to this value. Adata-range0-10^indicates that metric values greater than 10 should produce notes as if 10 was observed, but that any measurements less than 0 should be ignored, and so not played.
Here are some example note attributes with brief explanations.
note = hi, 0, 35, 60, 10, apache.severity, error
Play note 60 of program (instrument) 35, bank 0 of the
hi SoundFont file for a duration of 10 deciseconds
(or 1 s) if the apache.severity metric has a
value of error. If the datatree provided contains no
apache.severity then no note is sounded.
note = 1, 0, 3, 38-80, 2, apache.transferred, 0 - 4096^
Play program (instrument) 3, bank 0 of the first loaded SoundFont for 2 decisecond (0.2 s) with the pitch dependant on the size transferred. The note range is 38 to 80, with corresponding values of 0 kB to 4 kB: higher metric values result in higher pitch notes. Values of transfer size greater than 4 kB are played, but truncated, resulting in a note at pitch 80 being played.
note = hi, 0, 75, 60-80, 4, apache.Threads.waiting, 10^ - 0
Play program 75, bank 0 of the hi SoundFont for 4
deciseconds (0.4 s) based on the number of threads in
waiting state. Note 80 is played when 10 (or more)
threads are in waiting state; note 60 if there is no thread in
this state; if there are 1 to 9 threads, the results are somewhere
in between.
There are a number of other options that may improve the performance of the embedded fluidsynth engine. They are described briefly in the summary of this plugin's options below,
Attributes
- soundfont string, ignored/required
a comma-separated list of a nickname and an absolute path to the SoundFont file. The attribute may be repeated to load multiple SoundFont files. When using the fluidsynth library, the soundfont attributes are required; when connecting to a external fluidsynth program these attributes are ignored.
- note string, required
Each note attribute indicates sensitivity to some metric's value. Multiple note attributes may be specified, one for each metric.
The note attribute values are a comma-separated list. The seven items are: the SoundFont short-name or instance count, bank (integer), program (integer), note-range, duration (integer), source (datatree path), data-range. The SoundFont short-name is defined by the soundfont attribute.
- bufsize integer, optional
the desired size for the audio buffers, in Bytes. This is ignored when connecting to an external fluidsynth program.
- bufcount integer, optional
how many audio buffers there should be. Each buffer has size given by the bufsize attribute. This attribute is ignored when connecting to an external fluidsynth program.
- driver string, optional
the output driver. The default is “ALSA”. Other common possibilities are “OSS” and “JACK”. This attribute is ignored when connecting to an external fluidsynth program.
- alsadevice string, optional
the output ALSA device. Within MonAMI, the default is “
hw:0” due to performance issues with the ALSA default device “default”. This attribute is ignored when connecting to an external fluidsynth program.- samplerate integer, optional
the sample rate to use (in Hz). The default will be something appropriate for the sound hardware. This attribute is ignored when connecting to an external fluidsynth program.
- reverb integer, optional
whether the reverb effect should be enabled. “0” indicates disabled, “1” enabled. Default is enabled. Disabling reverb may reduce CPU impact of running fluidsynth. This attribute is ignored when connecting to an external fluidsynth program.
- chorus integer, optional
whether the chorus effect should be enabled. “0” indicates disabled, “1” enabled. Default is enabled. Disabling chorus may reduce CPU impact of running fluidsynth. This attribute is ignored when connecting to an external fluidsynth program.
- maxnotes integer, optional
the maximum number of concurrent notes. If more than this is attempted, some notes may be silenced prematurely. This attribute is ignored when connecting to an external fluidsynth program.
Ganglia is a monitoring system that allows multiple statistics to be gathered from many machines and those statistics plotted over different time-periods. By default, it uses multicast to communicate within a cluster, and allows results from multiple clusters to collated as a single “grid”. More information about Ganglia can be found within the Ganglia project site and a review of the Ganglia architecture is presented in the paper the ganglia distributed monitoring system: design, implementation, and experience..
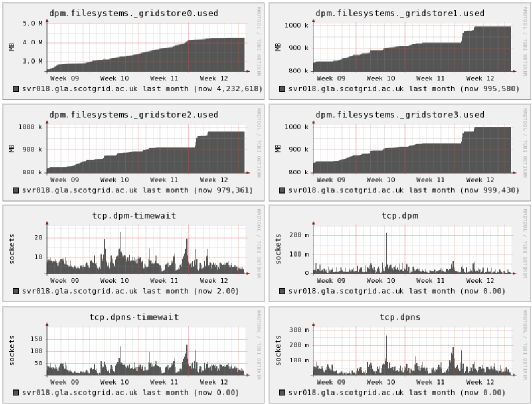
Ganglia comes with a standard monitoring daemon (gmond) that monitors a standard set of statistics about a particular machine. It also includes a command-line utility (gmetric) that allows for the recording of additional metrics.
The MonAMI ganglia plugin emulates the gmetric program and can send additional metrics within a Ganglia-monitoring cluster. These appear automatically on the ganglia web-pages, either graphically (for graphable metrics) or as measured values.
Note
Please note that there is a bug in Ganglia prior to v3.0.0 that can result in data corruption when adding custom data. MonAMI will trigger this bug, so it is strongly recommended to upgrade Ganglia to the latest version.
Network configuration
The Ganglia gmond daemon loads its configuration from a file
gmond.conf. For some distributions, this
file is located at /etc/gmond.conf, for other
it is found at /etc/ganglia/gmond.conf. The
ganglia plugin can parse the
gmond.conf file to discover how it should
deliver packets. It searches both standard locations for a
suitable file. If found, it will use the setting contained within
the file, so no further configuration is necessary. If a suitable
gmond configuration file exists at some other location, the
plugin can still use it. The config
attribute can be set to the config file's location.
Although it is recommended to run MonAMI in conjunction with gmond, this is not a requirement. In the absence of a suitable gmond configuration file, the multicast channel and port to which metric updates should be sent can be set with the multicast_ip_address and multicast_port attributes respectively. By default, the kernel will choose to which network interface the multicast traffic is sent. If this decision is wrong, the interface can be specified explicitly using the the multicast_if attribute.
Serialisation
MonAMI uses a tree-structure for storing metrics internally. In contrast, Ganglia uses a flat name-space for its metrics. To send data to Ganglia, the metric names must be “flattened” to a simple name.
To obtain the Ganglia metric name, the elements of the metric's
path are concatenated, separated by a period (.)
character. For example, the metric
torque.Scheduler.period is the period, in seconds,
between successive calls Torque makes to the scheduler (see Section 3.4.15, “Torque”).
Since the period character has a special meaning to the ganglia plugin, it is recommended to avoid using this character elsewhere, for example, within torque group names. Although there are no problems with sending the resulting metrics, it introduces a source of potential confusion.
Avoiding metric loss
Ganglia uses multicast UDP traffic for metric updates, which is
unreliable protocol. Unlike the reliable TCP protocol, UDP
has no mechanisms for detecting if a packet was not delivered or
for retransmitting missing data. However, over local area
networks it is very unlikely that the network packets will be
lost.
If a large number of metrics are updated at the same time, there is a corresponding deluge of packets. If these packets are delivered too quickly, the recipient gmond process may not be able to keep up. Those packets not accepted immediately by gmond will be held in a backlog queue, allowing gmond to process them when free. However, if the size of this backlog queue exceeds a threshold, further packets will not be queued and gmond will not see the corresponding metric update messages. The threshold varies, but observed values are in the range 220–450 packets.
To reduce the risk of metric updates being lost, the MonAMI ganglia plugin will pause after delivering a multiple of 50 metric updates. By default the pause is 100 ms, but the delivery_pause attribute can be used to fine-tune this behaviour. Under normal circumstances, the default delivery_pause value results in a negligible risk of metric updates being lost. However, if the machine receiving the metrics is under heavy load you may notice metrics being dropped.
To further reduce the risk of metric update loss, monitoring
activity can be split into separate activities that are triggered
at different times. In the following example, two monitoring
targets (torque and maui) are sampled
every minute with all metrics sent to Ganglia.
[torque]
 cache = 60

[maui]
 cache = 60

[sample]
 interval = 1m
 read = torque, maui
 write = ganglia

[ganglia]
If the resulting datatree has too many metrics there will be a risk that some of metric updates will be lost. To reduce the risk of this, the same monitoring can be achieved by splitting the activity into two parts. The following example shows the same monitoring but split into two independent activities. Both monitoring targets are monitored every minute but now at different times.
[torque]
 cache = 60

[maui]
 cache = 60

[sample]
 interval = 1m
 read = torque
 write = ganglia

[sample]
 interval = 1m
 read = maui
 write = ganglia

[ganglia]
An alternative approach is to increase the UDP packet buffer size. Increasing the buffer size will allow more packets to be queued before metric updates are lost. The following set of commands, run as root, will restart gmond with a larger network receive buffer (N.B. the hash character represents the prompt and should not be typed).
# orig_default=$(cat /proc/sys/core/rmem_default)
# cat /proc/sys/net/core/rmem_max > /proc/sys/net/core/rmem_default
# service gmond restart
# echo $orig_default > /proc/sys/net/core/rmem_default
Another method of setting rmem_default is to use the
/etc/sysctl.conf file. A sample entry is
given below:
#  Enlarge the value of rmem_default for gmond.  Be sure to check the
#  number against /proc/sys/net/core/rmem_max.
net.core.rmem_default=131071
dmax
Each metric has a corresponding dmax value. This value specifies when Ganglia should consider the metric as no longer being monitored. If a metric has not been updated for dmax seconds Ganglia will remove it. Graphs showing historical data are not purged; however, when delivery of the metric resumes there may be a corresponding gap in the historical data.
As a special case, if a metric's dmax value is set to zero, Ganglia will never purge that metric. Should MonAMI stop updating that metric, its last value will be graphed indefinitely, or until either MonAMI resumes sending fresh data or the metric is flushed manually (by restarting the gmond daemon).
The optimal value of dmax is a compromise. If the value is set too low then an unusually long delay whilst gathering data might trigger the metric being purged. If set too high, then Ganglia will take longer than necessary to notice if MonAMI has stopped sending data.
When updating a metric, a fresh value of dmax is also sent. This allows MonAMI to adjust the dmax value over time. For event-driven data the default value is zero, effectively disabling the automatic removal of data. With internally triggered data (e.g., data collected using a sample target), the value of dmax is calculated taking into account when next data is scheduled to be taken and an estimate of how long that data acquisition will take. Section 3.3.4, “Estimating future data-gathering delays” describes how MonAMI estimates the delay in future data-gathering.
Calculating a good value of dmax also requires knowledge of the
gmetad polling interval: the time between successive gmetad
requests to gmond. This is specified in the gmetad
configuration file (usually either
/etc/gmetad.conf or
/etc/ganglia/gmetad.conf). Each
data_source line has an optional polling interval
value, expressed in seconds. If the polling interval is not
specified, gmetad will use 15 seconds as a default value.
In general, the MonAMI ganglia plugin cannot discovering the gmetad polling interval automatically. Instead, the dmax calculation assumes the polling interval is less than two minutes. This is very likely to be sufficient; but, should the gmetad polling interval be longer than two minutes, the correct value can be specified (in seconds) using the gmetad_poll attribute.
Separate from estimating a good value of dmax, an explicit dmax value can be specified using the dmax attribute. For example, setting the dmax attribute to zero will set all metric update's dmax values to zero unconditionally, so preventing Ganglia from purging any metric.
It is recommended that the default value of dmax is used. If long gmetad polling intervals are in use, include a suitable gmetad_poll attribute.
Multiframe extension
Ganglia's standard web interface provides a good overview of the metrics supplied by gmond, but for other metrics are displayed either as a single graph or not at all.
To provide a rich view of the data MonAMI collects, an extension to the standard web interface has been developed. This supports creating tables, custom graphs and pie-charts, support for iGoogle and embedding elements within other pages.
The multiframe extension is currently maintained within the external CVS module. Instructions on how to install and extend these graphs are available within that module.
Attributes
- multicast_ip_address string, optional
the multicast IP address to which the data should be sent. If no IP address is specified, the Ganglia default value of
239.2.11.71is used.- multicast_port integer, optional
the port to which the multicast traffic is sent. If no port is specified, the Ganglia default port of 8649 is used.
- host string, optional
The
IPaddress of the host to whichUDPunicast traffic should be sent. Specifying this option will switch off sending metrics as multicast. The default is not to send unicast traffic, but to send multicast traffic.- port integer, optional
the
UDPport to which unicast traffic should be sent. If host is specified and port is not then the default port is used. If host is not specified, then port has no effect.- multicast_if string, optional
the network device through which multicast traffic should be sent (e.g., “eth1”). If no device is specified, a default is chosen by the kernel. This default is usually sufficient.
- config string, optional
the non-standard location of a gmond configuration file.
- gmetad_poll integer, optional
the polling interval of gmetad in seconds. This is the time between successive gmetad requests to gmond. By default, the plugin assumes this is two minutes or less. If this is wrong, the correct value is specified using this attribute.
- dmax integer, optional
the absolute period, in seconds, after the last metric update after which Ganglia should remove that metric. A value of zero disables this automatic purging of metrics. By default, the plugin will estimate a suitable value based on observer behaviour when gathering data.
- delivery_pause integer, optional
the delay in milliseconds between an exact multiple of 50 and the following metric update. Every 50 UDP packets, the plugin will pause briefly. The default (100 ms) is an empirical value that should be sufficient. The minimum and maximum values are 5 ms and 2000 ms.
GridView is a Worldwide LHC Computational Grid (WLCG) project that provides centralised monitoring for the WLCG collaboration. It collates information from multiple sources, including R-GMA and MonaLisa, and displays this aggregated information. In addition to accumulated data, it can accept data sent directly via a web-service, which is how this reporting plugin works. The protocol allows arbitrary data to be uploaded. Live data and further details are available from the GridView homepage.
The gridview plugin implements the GridView protocol, allowing data to be uploaded directly into GridView. Each datatree sent is directed towards a particular table, as described by the table attribute. The table name is arbitrary and describes the nature of the data and contains one or more fields. The number of fields and each of the fields type is table-specific.
The send attribute is a comma-separated
list of which data, and in what order data is to be sent. Each
element of the list is the name of some element within a datatree;
elements are separated by a dot (.). Should any of
the elements be missing, the corresponding field sent to GridView
will be blank.
Attributes
- table string, required
the name of the table within GridView to populate with data.
- send string, required
the comma-separated list of data to send: one entry for each field. The data should be a path within a datatree using a dot (
.) as the separator between names within the datatree.- endpoint string, optional
the SOAP endpoint to which MonAMI should contact. The default endpoint is
http://grvw003.cern.ch:8080/wsarch/services/WebArchiverAdv
Gr_Monitor is an application that uses the OpenGL API to display monitoring information as a series of animated 3D bar charts. More information is available from the Gr_Monitor home page.
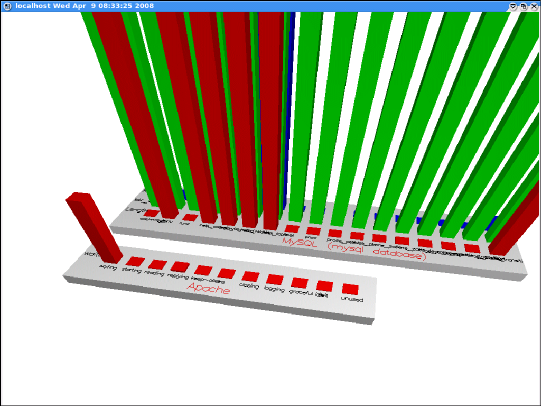
Gr_Monitor uses a flexible XML format for data exchange. This allows it to receive data from a variety of helper applications, each of which collect information from different sources. Further custom applications allow easy expansion of gr_Monitor's capabilities.
Recent versions of gr_Monitor provide the facility to receive this
XML data from the network (through a TCP connection). The
MonAMI grmonitor plugin provides a network socket that
the gr_Monitor application can connect to. To connect gr_Monitor
to MonAMI, use the -tcp option:
gr_monitor -tcp
hostname:port
The option hostname
should be replaced with the hostname of the MonAMI daemon (e.g.,
localhost) and port
should be replaced by whatever TCP port number MonAMI is
listening on (50007 by default).
Metrics from a datatree are mapped to positions within groups of 3D bar charts, which gr_Monitor then plots. To configure this mapping, the grmonitor plugin expects at least one of each of the following attribute: group, metric, metricval, and either item or itemlist. All of the attributes may be repeated.
A group is a rectangular collection of metrics, usually with a common theme; for example, in Figure 3.3, “gr_Monitor showing data from apache and mysql targets” there are two groups: one shows Apache thread status, the other shows per-table metrics for a MySQL database. Each group has a label or title and is displayed as a distinct block in the 3D display. In the MonAMI configuration, group attribute values have a local-name for the group, a colon, then the display label for this group. The group local-name is used when defining how the group should look and the label is passed to gr_Monitor to be displayed.
The item attribute describes a specific column within a group. Typically, each item describes one of a list of things; for example, one filesystem of several mounted, a queue within the set of batch-system queues, a table within the many a database stores. The item values have the group short-name, a comma, an item short-name, a colon, then the display label for this item. An item short-name is used to identify this item and the display label is passed on to gr_Monitor.
A metric attribute describes a generic measurable aspect of the items within a group; e.g., used capacity and free capacity (for filesystems), or number of jobs in running state and number in queued state for a batch system. The metric correspond to the rows of related information shown in Figure 3.3, “gr_Monitor showing data from apache and mysql targets”. The metric values have the form group short-name, comma, metric short-name, colon, then the label. The metric short-name is used to identify this metric and the label is passed on to gr_Monitor as the label it should display for this row.
The final required attribute type is metricval. The metricval attributes map the incoming datatree to bars within the 3D bar-chart. There should be a metricval for each (item,metric) pair in each group. metricval attribute values have a comma-separated list of group, item and metric short-names, a colon, then the datatree path for the corresponding MonAMI metric.
The following example demonstrates configuring a grmonitor target. It defines a single group “Torque queue info” with three items (columns) “Atlas”, “CMS” and “LHCb”. Each item has two metric attributes: “Running” and “Queued”. The metricval attributes map an incoming datatree to these values.
[grmonitor]
 group = g1 : Torque queue info

 metric = g1, m_running : Running
 metric = g1, m_queued  : Queued

 item = g1,i_atlas : Atlas
 item = g1,i_cms   : CMS
 item = g1,i_lhcb  : LHCb

 metricval = g1,i_atlas, m_running: \
             torque.Queues.Execution.ByQueue.atlas.Jobs.State.running
 metricval = g1,i_atlas, m_queued: \
             torque.Queues.Execution.ByQueue.atlas.Jobs.State.queued

 metricval = g1,i_cms, m_running: \
             torque.Queues.Execution.ByQueue.biomed.Jobs.State.running
 metricval = g1,i_cms, m_queued: \
             torque.Queues.Execution.ByQueue.biomed.Jobs.State.queued

 metricval = g1,i_lhcb, m_running: \
             torque.Queues.Execution.ByQueue.lhcb.Jobs.State.running
 metricval = g1,i_lhcb, m_queued: \
             torque.Queues.Execution.ByQueue.lhcb.Jobs.State.queued
Using itemlist
Writing out all metricval attributes can be quite tiresome and error prone. The data provided by a datatree might also change over time, perhaps dynamically whilst MonAMI is running. For these reasons, MonAMI supports an express method of describing the mapping, which uses the itemlist attribute. This makes the mapping more dynamic and its description more compact.
The itemlist replaces the need for specifying item attributes explicitly. A group should have at least one item or itemlist otherwise no data would be plotted.
The itemlist attribute is similar to an item but, instead of specifying the label, the value after the colon specifies a branch of the datatree. Specifying an itemlist also affects how metricval attributes are interpreted.
When a new datatree is received, the grmonitor target
will look for the specified branch and will consider each child
entry as an item. For example, if the incoming datatree has a
branch aa.bb with two child branches
aa.bb.item1 and aa.bb.item2, specifying
an itemlist attribute with
aa.bb is equivalent to specifying two
items labelled “item1” and
“item2”. This is most useful when the indicated
branch contains a list of similar items.
The metric attributes are as before; they provide the graphical labels for the metrics. There must be a metric value for each row within the group.
The metricval attributes describe the path
within the datatree to the desired metric, relative to the item's
branch. If the itemlist specifies a path
aa.bb and the metricval
specifies xx.yy, then values will be plotted for:
aa.bb.item1.xx.yy (labelled “item1”),
aa.bb.item2.xx.yy (labelled “item2”),
etc. These must be valid metrics or they will be ignored.
metricval attributes may take a special
value: a single dot. This indicates that the immediate children
of the itemlist path should be plotted
directly. For example, if an itemlist
attribute has a value of aa.bb and
metricval is . then values
will be plotted for aa.bb.item1 (as
“item1”), aa.bb.item2 (as
“item2”), and so on. A
metricval with a dot will only plot metrics
if the items immediately below the itemval branch are metrics,
branches will be ignored.
The following example demonstrates itemlist and illustrates using both metricval to point to metrics and the special dot value. It creates two groups: one that plots the number of Apache thread in each state (for details, see Section 3.4.2, “Apache”) and another that plots three metrics from MySQL (see Section 3.4.8, “MySQL”). The MySQL group plots three table-specific metrics for all tables in the mysql database. This is the configuration that produced the output shown above in Figure 3.3, “gr_Monitor showing data from apache and mysql targets”.
[grmonitor]
 group = gApache : Apache
 itemlist = gApache, iThreadState : apache.Threads
 metric = gApache, mCount : Count
 metricval = gApache, iThreadState, mCount : .

 group = gMysql : MySQL (mysql database)
 metric = gMysql, mCurLen : Length
 metric = gMysql, mIdxLen : Idx length
 metric = gMysql, mRows   : Rows
 itemlist = gMysql, iDbMysql: mysql.Database.mysql.Table
 metricval = gMysql, iDbMysql, mCurLen :  Datafile.current
 metricval = gMysql, iDbMysql, mIdxLen :  Indexfile.length
 metricval = gMysql, iDbMysql, mRows   :  Rows.count
Attributes
- port integer, optional
the network port on which the plugin will listen. If not specified, then the default (50007) is used.
- group string, at least one
defines a rectangular set of data results, forming a 3D bar chart. Attribute values have the form
group name:group label- metric string, at least one per group
hold information about a row of data within a group. Attribute values have the form
group name,metric name:metric label- item string, at least one per group (if there are no itemlist attributes)
describes a column of data within a group. Attribute values have the form
group name,item name:item label- itemlist string, at least one per group (if there are not item attributes)
describes a set of columns of data within a group, by specifying a branch within the incoming datatree. The immediate child of this branch are considered part a list of items.
Attribute values have the form
group name,item name:branch path- metricval string, one per (group,metric,item)
Definition of which MonAMI metric maps to a particular location within a group. Attributes values have the form
group name,item name,metric name:metric path
KSysGuard is a default component of the KDE desktop environment.
It is designed for monitoring computers and separates monitoring
into two distinct activities: gathering information and presenting
it to the user. Displaying information is achieved with a GUI
program KSysGuard (written using the KDE framework) whilst
gathering data is handled by a small program, ksysguardd, that
can run as a remote daemon. The ksysguard MonAMI plugin
emulates the ksysguardd program, allowing KSysGuard to
retrieve information.
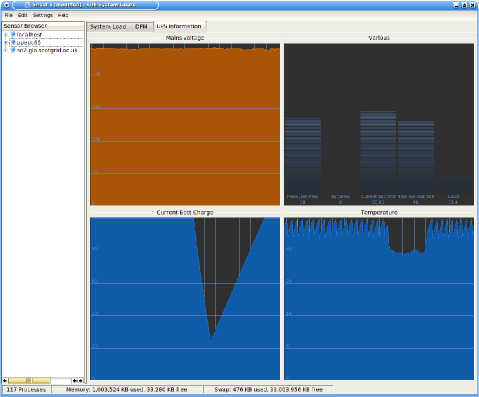
KSysGuard supports a variety of display-types (different ways of displaying sensor data). Some of these display-types allow data from multiple sensors to be combined. Worksheets (panels with a grid of different displays) are easily updated using drag-and-drop and can be saved for later recall.
KSysGuard and ksysguardd communicate via a documented
stream-protocol. Typical default usage has ksysguardd started
automatically on the local machine, with communication over the
process' stdout and stderr file-handles.
Collecting data from remote machines is supported by KSysGuard
either via ssh or using direct TCP communication. With the
ssh method, the GUI establishes an ssh connection to the
remote machine and executes ksysguardd (data is transfered
through ssh's tunnelling of stdout and stderr). With the
TCP method, KSysGuard establishes a connection to an existing
ksysguardd instance that is running in network-daemon mode.
The MonAMI ksysguard plugin implements the KSysGuard
stream-protocol and acts like ksysguardd running as a daemon.
By default, it listens on port 3112 (ksysguardd's default port)
and accepts only local connections. A more liberal access policy
can be configured by specifying one or more
allow attributes.
Note
Older versions of ksysguard contained a bug that was triggered by a sensor name containing spaces. This was fixed in KDE v3.5.6 or later.
To view the data provided by MonAMI within KSysGuard, select → , which will open a dialogue box. Enter the hostname of the machine MonAMI is running on in the Host input and make sure the Connection Type is set to Daemon. You should see the host's name appear within the sensor-browser tree (on the left of the window). Expanding the hostname will trigger KSysGuard to query MonAMI for the list of available metrics. If this list is long, it can take a while for KSysGuard to parse the list.
More details on how to use KSysGuard can be found in the KSysGuard Handbook.
Within MonAMI, the ksysguard target configured must specify a target from which the data is requested (via the read parameter). This source can be either an explicit monitoring plugin (e.g., using a target from the apache plugin) or a named sample target. The named sample can either act solely as an aggregator for KSysGuard (i.e., with no write or interval specified) or can be part of some other monitoring activity. See Section 3.6, “sample” for more information on sample targets.
The following example shows the ksysguard plugin directly
monitoring an Apache server running on
www.example.org
[apache]
 host = www.example.org

[ksysguard]
 read = apache
The following example demonstrates how to use a named-sample to monitor multiple monitoring targets with KSysGuard.
[apache]
  name = external-server
  host = www.example.org

[mysql]
  name = external-mysql
  host = mysql-serv.example.org
  user = monami
  password = monami-secret
  cache = 10

[apache]
  name = internal-server
  host = www.intranet.example.org

[mysql]
  name = internal-mysql
  host = mysql-serv.intranet.example.org
  user = monami
  password = monami-secret
  cache = 10

[sample]
  name = ksysguard-info
  read = external-server, external-mysql, internal-server, internal-mysql

[ksysguard]
  read = ksysguard-info
Attributes
- read string, required
the name of the target from which data is to be requested
- port integer, optional
the port on which the ksysguard target will listen for connections. If no port is specified, then 3112 will use, the default for
ksysguardd.- allow string, optional
a host or subnet from which this plugin will accept connections. This can be specified as a simple hostname (e.g.,
mydesktop), a fully qualified domain name (e.g.,www.example.com), an IPv4 address (e.g.,10.1.0.28), an IPv4 address with a netmask (e.g.10.1.0.0/255.255.255.0) or an IPv4 subnet using CIDR notation (e.g.,10.1.0.0/24).The plugin will always accept connections from
localhostand from the host's fully qualified domain name.This attribute can be repeated to describe all necessary authorised hosts or networks.
This plugin pushes information gathered by MonAMI into the
MonALISA monitoring system (MonALISA home
page). It does this by sending the data
within a UDP packet to a MonALISA-Service (ML-Service) server.
ML-Service is a component of MonALISA that can be located either
on the local site or centrally.
Within the MonALISA (ML) hierarchy, a cluster contains one or more nodes (computers). These clusters are grouped together into one or more farms. Farms are handled by MonALISA-Services (ML-Services), usually a single farm per ML-Service. The ML-Service is a daemon that is responsible for collecting monitoring data, and providing both a temporary store for that data and a means by which that data can be acquired.
Clients query the data provided by ML-Services via transparent proxies. There are also LookUp Services (LUSs) that contain soft-state registrations of the proxies and ML-Services. The LUSs provide a mechanism by which client requests are load-balanced across different proxies and dynamic data discovery can happen.
The ML-Services acquire data through a number of MonALISA plugins. One such plugin is XDRUDP, which allows nodes to send arbitrary data to the ML-Service. The MonALISA team provide an API for sending this data called ApMon. It is through the XDRUDP ML-plugin that MonAMI is able to send gathered data.

Note that each MonAMI monalisa target reports to a specific host, port, cluster triple. If you wish to report data to multiple ML-Services or to multiple ML clusters, you must have multiple MonAMI monalisa targets configured: one for each host or cluster.
Attributes
- host string, optional
the hostname of the ML-Service. The default value is
localhost.- port integer, optional
the port on which the ML-Service listens. The default value is 8884.
- password string, optional
the password to access the MonAlisa service.
Warning
The password is sent plain-text: don't share a sensitive password with MonALISA! By default, no password is sent.
- apmon_version string, optional
the plugin reports “2.2.0” as an ApMon version string by default. This option allows you report a different version.
- cluster string, required
the cluster name to report.
- node string, optional
the node name to report. There are two special cases: if the literal string
IPis used, then MonAMI will detect the IP address and use that value; if the literal stringFQDNis used, then MonAMI will determine the machine's Fully Qualified Domain Name and use that. The default is to report the machine's FQDN.
In addition to monitoring a MySQL server, the mysql plugin can also append monitoring data into a table. If correctly configured, each datatree the plugin receives will be stored as a new row within a specified table.
The two MySQL operations (monitoring and storing results) are not mutually exclusive. A mysql target can be configured to both store data and also to monitoring the MySQL server it is contacting.
Two attributes are required when using the mysql plugin for storing results: database and table. These specify into which MySQL database and table data is to be stored.
If the database named in the database attribute does not exist, no attempt is made to create it. This will prevent MonAMI from storing any data.
If the table does not exist, the plugin will attempt to create it when it receives data. The plugin determins the types for each field from the field's corresponding metric. If, when creating the table, a field attribute has no corresponding metric within the incoming datatree, the corresponding field within the database table is created as TEXT.
Privileges
In order to insert data, the MySQL user the plugin authenticates as must have been granted sufficient privileges. Additional privileges are needed if you wish to allow the plugin to create missing tables as needed.
The following SQL commands describes how to create a database
mon_db, create a MySQL user account
monami with password
monami-secret
CREATE USER 'monami' IDENTIFIED BY 'monami-secret'; CREATE DATABASE mon_db; GRANT CREATE,INSERT ON mon_db.* TOmonami;
A lightly more secure, but more awkward solution is to manually
create the storage tables. The following SQL commands describe
how to create a database mon_db, create an
example table roomstats, create
a MySQL user account monami
with password monami-secret, and grant that user
sufficient privileges to insert data only for that table.
CREATE USER 'monami' IDENTIFIED BY 'monami-secret'; CREATE DATABASE mon_db; CREATE TABLE roomstats ( collected TIMESTAMP, temperature FLOAT, humidity FLOAT, aircon1good BOOLEAN, aircon2good BOOLEAN); GRANT INSERT ON mon_db.roomstats TOmonami;
Fields
One must describe how to fill in each of the table's fields. To do this, the configuration should include several field attributes, one for each column of the table.
A field attribute value has the form:
field : metric pathfieldmetric
path
The collected field
The collected field is a special case. It stores the timestamp of when the datatree data was obtained. The table must have a column with this name with type TIMESTAMP. This field is filled in automatically: there is no need for a field attribute to describe the collected field.
The following example shows a suitable configuration for storing gathered data within the above room_stats table. The datatree is fictitious and purely illustrative.
[mysql] user =monamipassword =monami-secretdatabase = mon_db table = room_stats field = temperature : probes.probe1.temperature field = humidity : probes.probe1.humidity field = aircon1good : aircons.aircon1.good field = aircon2good : aircons.aircon2.good
Attributes
- host string, optional
the host on which the MySQL server is running. If no host is specified, the default
localhostis used.- user string, required
the username with which to log into the server.
- password string, required
the password with which to log into the server
- database string, required
the database in which the storage table is found. If this database does not exist then no data can be stored.
- table string, required
the table into which data is stored. If the table does not exist, it is created automatically.
- field string, at least one
a mapping between a metric from a datatree and a database field name. This attribute should be specified for each table column and has the form
field:datatree path
Nagios is a monitoring system that provides sophisticated service-status monitoring: whether a service's status is OK, Warning or Critical. Its strengths include support for escalation and flexible support for notification and potentially automated service recovery. A complete description of Nagios is available at the Nagios home page.
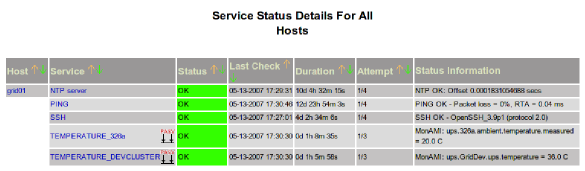
The Nagios monitoring architecture has a single Nagios central server. This Nagios server maintains the current status of all monitored hosts and the services offered by those hosts. It is the central Nagios server that maintains a webpage front-end and that responds to status changes. For remote hosts, Nagios offers two methods of receiving status updates: active and passive.
Active queries are where the Nagios server initiates a connection to the remote server, requests information, then processes the result. This requires a daemon (npre) to be running and a sufficient subset of the monitoring scripts to be installed on the remote machine.
With passive queries, the remote site sends status updates to the Nagios server, either periodically or triggered by some event. To receive these messages, the Nagios server must either run the nsca program as a daemon, or run a inetd-like daemon to run nsca on-demand.
Caution
There is a bug in some versions of the nsca program. When triggered, nsca will go into a tight-loop, so preventing updates and consuming CPU. This bug was fixed with version 2.7.2. Make sure you have at least this version installed.
MonAMI will send status information to the Nagios server. This follows the passive query usage, so nsca must be working for Nagios to accept data from MonAMI.
Nagios and nsca
This section gives a brief overview of how to configure Nagios to accept passive monitoring results as provided by nsca. Active monitoring is the default mode of operation and often Nagios is deployed with passive monitoring disabled. Several steps may be required to enable it. The information here should be read in conjunction with the Nagios documentation. Also, if nsca is packaged separately, make sure the package is installed.
Location of Nagios configuration
The Nagios configuration files are located either in /etc or, with more recent packages,
in /etc/nagios. It is
also possible that they may be stored elsewhere, depending on
the local installation. For this reason, when Nagios
configuration files are mentioned, just their base name will be
given rather than the full path.
To run nsca as part of an xinetd make sure there is a suitable
xinetd configuration file (usually located in /etc/xinetd.d). Some packages also
include suitable configuration for xinetd, but usually disabled
by default. To enable nsca, make sure the disabled
field within the nsca's xinetd-configuration file is set to
no and restart xinetd.
To run nsca as part of inetd, add a suitable line to the
inetd configuration file /etc/inetd.conf
and restart inetd.
To run nsca as a daemon, independent of any inetd-like
service, make sure no inetd-like service has adopted nsca
(e.g., set disabled in the corresponding xinetd
configuration file to yes, or comment-out the line in
inetd configuration) and start nsca as a daemon (e.g.,
service nsca start).
Passive monitoring requires that Nagios support external commands.
The packaged default configuration may have this switched off. To
enable external commands, make sure the
check_external_commands parameter is set to
1. This option is usually located in the main
configuration file, nagios.cfg. Nagios will
need to be restarted for this to have an effect.
Make sure Nagios can create the external command socket. The
default location is within the /var/log/nagios/rw directory. You
may need to change the owner of that directory to the user the
Nagios daemon uses (typically nagios).
If there are problems with communication between MonAMI and
nsca, the nsca debugging option can be useful. Debugging is
enabled by setting debug=1 in the nsca
configuration file: nsca.cfg. The debug
output is sent to syslog, so which file the information can be
found in will depend on the syslog configuration. Typically, the
output will appear in either
/var/log/messages or
/var/log/daemon.
Adding passive services to Nagios
Nagios only accepts passive monitoring results for services it knows about. This section describes how to add additional service definitions to Nagios so MonAMI can provide status information.
Nagios supports templates within its configuration files. These allow for a set of default service values. If a service inherits a template, then the template values will be used unless overwritten. The following section gives a suitable template for a MonAMI service; you may wish to change these values to better suite your environment.
define service {
     name                      monami-service
     use                       generic-service
     active_checks_enabled     0
     passive_checks_enabled    1
     register                  0
     check_command             check_monami_dummy
     notification_interval     240
     notification_period       24x7
     notification_options      c,r
     check_period              24x7
     contact_groups            monami-admins
     max_check_attempts        3
     normal_check_interval     5
     retry_check_interval      1
}
Note how the active checks are disabled, but passive checks are
allowed. Also, the contact_groups has been set to
monami-admins. Either this contact group must be
defined, or a valid group be substituted.
In the above template, a check_command was specified.
Nagios requires this value to be set, but as active checks are
disabled, any valid command will do. To keep things obvious, we
use the explicit check_monami_dummy command. The
following definition is valid and can be placed either in
commands.cfg or in some local collection of
extra commands.
define command {
   command_name    check_monami_dummy
   command_line    /bin/true
}
The final step is to add the services Nagios is to accept status
information. These definitions will allow MonAMI to upload status
information. The definitions should go within one of the Nagios
configuration files mentioned by cfg_file= in
nagios.cfg.
The following two examples configure specific checks for a named host.
define service {
     use                       monami-service
     host_name                 grid01
     service_description       TOMCAT_WEB_THREADS_CURRENT
}

define service {
     use                       monami-service
     host_name                 grid01
     service_description       TOMCAT_WEB_THREADS_INUSE
}
The following example shows a service check defined for a group of hosts. Hosts acquire the service check based on their membership of the hostgroup. This is often more convenient when several machines are running the same service.
define hostgroup {
     hostgroup_name    DPM_pool_nodes
     alias             All DPM pool nodes.
     members           disk001, disk002, disk003, disk005, disk013
}

define service{
     use                       monami-service
     hostgroup_name            DPM_pool_nodes
     service_description       DPM_free_space
}
Configuring MonAMI
To allow MonAMI to report the current state of various services, one must configure a nagios reporting target. This describes both the machine to which MonAMI should connect, and the services that should be reported.
The host attribute describes the remote
host to which status information should be sent. If no host is
specified, MonAMI will attempt to contact nsca running on the
machine on which it is running (localhost). The
port attribute describes on which TCP
port the nsca program is listening. If no
port is specified, then the nsca default
port is used.
To be useful, each nagios target must define at least one
service. Each service must have a corresponding definition within
Nagios (as described above), else Nagios will ignore the
information. To define a service, the
service attribute is specified. The
service values have the following form:
short name :
    Nagios name
short namea simple name used to associate the service with the various check attributes.
Nagios namethe name of the service within Nagios. This is the
service_descriptionfield (as shown above). It is also the name the Nagios web interface will show.
Two example service definitions are given below. A nagios target can have an arbitrary number of definitions.
service = tcat-threads, TOMCAT_WEB_THREADS_INUSE
service = tcat-process, TOMCAT_PROCESS
Given a service definition, one or more
check attributes must be defined. The
checks determine the status (OK, Warning or
Critical) of a service. The check values
have the following form:
short name :
    data source,
    warn value,
    crit value
These fields have the following meaning:
short namethe short name from the corresponding service definition.
data soucethe path within a datatree to the metric under consideration.
warn valuethe first value that metric can adopt where the check is considered in Warning status.
crit valuethe first value that metric can adopt where the check is considered in Critical status.
When multiple check attributes are defined for a service, all the checks are evaluated and the service adopts the most severe status. In order of increasing severity, the different status are OK, Unknown, Warning Critical.
Examples of MonAMI configuration
The following is an example of a complete definition. A single service is defined that has a single check, based on output from the nut plugin (see Section 3.4.10, “NUT”.
[nagios]
 service = ups-temp, Temperature
 check = ups-temp, nut.myups.ups.temperature, 25, 35
The status of Temperature depends on
nut.apc3000.ups.temperature. If it is strictly less
than 25 Temperature has status OK. If 25 or more,
but strictly less than 34 it has status Warning and if 35 or
greater it has status Critical.
Another example, again using output from the nut plugin.
[nagios]
 service = ups-volt, Mains
 check = ups-volt, nut.myups.input.voltage.instantaneous, 260, 280
 check = ups-volt, nut.myups.input.voltage.instantaneous, 210, 190
The Mains service is OK if the mains voltage lies
between 210 V and 260 V, between 190 V and
210 V or between 260 V and 280 V its Warning and
either less than 190 V or greater than 280 V its
considered Critical.
Attributes
- host string, optional
the hostname to which the reporting plugin should connect. The default value is
localhost.- port integer, optional
the port to which the plugin should connect. The default value is 5667, the default for nsca.
- password string, optional
the password used for this connection. Defaults to not using a password.
- service string, optional
defines a service that is to be reported to Nagios. The format is
short name:Nagios name- check string, optional
defines a check for some service. A check is something that can affect the status of the reported service. The format is
short name:data source,warning value,critical value- localhost string, optional
defines the name the nagios plugin reports for itself when sending updates. By default, the plugin will use the FQDN. Specify this attribute if this is incorrect.
In addition to providing data (albeit, an empty datatree), the null plugin can also act as a reporting plugin, but one that will discard any incoming data.
A null target will act as an information sink, allowing monitoring activity to continue without the information being sent anywhere.
Attributes
The null plugin, used as a writer, does not accept any attributes.
The Service Availability Monitoring (SAM) is an in-production service monitoring system based in CERN. The GOC Wiki describes SAM further. Also available is a webpage describing the latest results.
The sam plugin allows information to be sent to a SAM monitoring host based on the methods described in the GOC Wiki.
Note
This module will have no effect unless the tests are registered prior to running the code.
The CERN server is firewalled, so running tests may not result in immediate success.
This is work-in-progress.
Attributes
- VO string, required
the VO name to include with reports.
- table string, required
the name of the table into which the data is to be added.
- node string, optional
the node name to report. This defaults to the machine's FQDN.
- endpoint string, optional
the end-point to which the reports should be sent. This defaults to
http://gvdev.cern.ch:8080/gridview/services/WebArchiver
The snapshot reporting plugin stores a representation of the last datatree it received in a file. Unlike the filelog plugin, snapshot provides no history information; instead, it provides a greater depth of information about the last datatree it received.
Attributes
- filename string, required
the filename of the file into which the last datatree is stored.
R-GMA (Relational Grid Monitoring Architecture) is an information system that allows data to be aggregated between many sites. It is based on the Open Grid Forum (formerly Global Grid Forum) architecture for monitoring, Grid Monitoring Architecture. R-GMA uses a Producer-Consumer model, with a Registry to which all producers register themselves periodically. Interactions with R-GMA are through a subset of SQL. Further information on R-GMA is available from the R-GMA project page and the R-GMA in 5 minutes document.
A typical deloyment has a single R-GMA server per site (within WLCG, this is the MON box). Within the R-GMA architecture, the producers are located within this R-GMA server. Local data is submitted to the R-GMA server and held there. External R-GMA clients (R-GMA Consumers) contact the R-GMA Producers to query the gathered data.
Locating the server
The rgma plugin allows MonAMI to upload data to an R-GMA server. Often this will not be the same machine on which MonAMI is running, so MonAMI must either discover the location of the server or use information in its configuration.
If the machine on which MonAMI is running has a properly installed
R-GMA environment, it will have a file
rgma.conf that states which machine is the
R-GMA server and details on how to send the data. Unfortunately,
this file can be located in many different locations, so its
location must be discovered too.
If the rgma_home attribute is specified,
MonAMI will try to read the R-GMA configuration file
rgma_home/etc/rgma/rgma.conf
If the rgma_home attribute is not
specified, or does not locate a valid R-GMA configuration file,
several environment variables are checked to see if they can
locate a valid R-GMA configuration file. MonAMI will tries the
environment variables RGMA_HOME,
GLITE_LOCATION and EDG_LOCATION,
each time trying to load the file
VAR/etc/rgma/rgma.conf.
If neither the rgma_home attribute nor any
of the environment variables, if specified, can locate the
rgma.conf file, a couple of standard
locations are tried. MonAMI will try to load /opt/glite/etc/rgma/rgma.conf and
/opt/edg/etc/rgma/rgma.conf.
If the file rgma.conf does not exist, the
host and TCP port of the R-GMA server may be specified
explicitly within the configuration file. The attributes
host, port and
access state to which host, on which port
and how securely the connection should be made. Usually
specifying just the host is sufficient.
In summary, to allow the rgma plugin to work, you must satisfy one of the following:
have a valid
rgma.conffile in one of its standard locations (/opt/glite/etc/rgma/or/opt/edg/etc/rgma/), ormake sure the MonAMI process has the correct
RGMA_HOME,GLITE_LOCATIONorEDG_LOCATIONenvironment variable set, orspecify the rgma_home attribute, locating the
rgma.conffile, orexplicitly set one or more of the following attributes: host, port, access, or
run MonAMI on the same machine as the R-GMA server.
Sending data
The R-GMA system resembles a relational database with data separated into different tables. Each table may have many columns, with data being supplied to any or all of those columns with one set of data.
Each rgma target delivers data to a single R-GMA table.
The table name must be specified and is given by the
table attribute. How data is delivered
within that table is defined by column
attributes. Each column attribute defines
a mapping between some metric within a datatree and an R-GMA
column name. The value of a column
attribute has the form
R-GMA column :
    metric name
    [option,
option]metric nametransfer.size in the
datatree to the R-GMA column size.
column = size : transfer.size
The optional square brackets within the column attribute values contain options that adjust rgma's behaviour for this data. These options are a comma separated list of keyword,value pairs, where the following keywords are available:
maxsizeThe maximum length of a string metric. If a string metric would be too long for this column, it is truncated so the last five characters are
[...].
The following example configures MonAMI to send a string metric that is never longer than 255 characters; a string will be truncated if it is longer.
column = filename : downloaded.filename [maxsize = 255]
R-GMA query types
R-GMA supports four types of query: continuous, history, latest and static.
A continuous query of a table will return data whenever it is inserted into that table. All matching data added to R-GMA will appear in a continuous query. It is possible to issue a continuous query that includes all old data before waiting for new data. Although this will return historic data, there is no guarantee for how long the R-GMA server will retain the data.
A reliable archive of the recent history of measurements or events is possible. A history query will return all matching data still present, but with a defined retention policy. To be a candidate for history queries, data must be marked for historic queries when it is inserted into a table. Any data not marked will be ignored by history queries.
R-GMA also understands the concept of the “latest” result. An R-GMA latest query selects the most recent measurement. However, to be considered, data must be marked as a candidate for latest queries when added. Any data that is not so marked is ignored.
A static query is a query that uses R-GMA's support for on-demand monitoring. Currently, rgma has no support for this query type.
When adding data, MonAMI will mark whether it should be considered for latest or historical queries (or both). This is controlled by the type attribute, a comma-separated list of query-types for which the data should be a candidate.
Data will always appear in continuous queries. By default, that
is the only query type data will appear in. If the
type list contains history
then data is marked for history queries and will also show up in
history queries. If it contains latest then it will
also show up in R-GMA latest queries.
Storage and retention of data
Data can be stored on the R-GMA server in one of two locations:
either in memory or within a database. By default, data is stored
in memory; however, the MonAMI storage
attribute can specify where R-GMA will store data. The valid
values are memory and database (for
storing in memory and within a database, respectively).
Note
The current implementations of R-GMA support history- and latest- queries only when data is stored within a database.
In general, data will be retained within R-GMA for some period. How long data is retained depends on several factors. If the data is neither marked for history nor latest queries then the retention period is not guaranteed.
The latest retention period is how long data is kept if it is marked for latest queries. R-GMA makes no guarantee to expunge the data at that precise time. The MonAMI default value is 25 minutes. This can be changed by setting the latest_retention attribute to the required duration, in minutes. If the data is not marked (by the type attribute) for latest queries then this has no effect.
The history retention period is the period of time after data is added that it is retained for history queries. R-GMA will guarantee to store for that period, but may retain it for longer. The MonAMI default value is 50 minutes, but this value can be changed by setting the history_retention attribute to the required duration, in minutes. If the data is not marked for history queries then this has no effect.
Security
The R-GMA service can accept commands through either an insecure
(HTTP) or secure (HTTPS) connection. With the insecure
connection, no authentication happens: anyone can insert data.
Adding data insecurely is the more simply and robust, but as
anyone can send fake data it is not recommended.
With Public Key Infrastructure (PKI), a host proves its identity with credentials that are split into two separate parts: one part is kept secret and the other is made public. The public part is the X509 certificate, which describes who the server claims to be and is signed by a trusted organisation. The secret part is the host's private key. This file must be kept securely and is needed when establishing a secure connection to verify that the server really is as claimed in the certificate.
When attempting to send data via a secure connection, the R-GMA server will only accepted connections established with a valid X509 certificate, one that the server can verify the complete trust-chain. A valid X509 host certificate has a common name (CN) that is identical to the host's fully qualified domain name (FQDN). To be useful, the certificate must have been issued by a certificate authority (CA) that the R-GMA server trusts. Trust, here, is simply that the CA's own certificate appears within the R-GMA server's CA directory (as specified within the R-GMA server's configuration).
The private key is precious: all security gained from using PKI
depends on the private key being kept secret. It is common
practice to allow only the root user (and processes running
with root privileges) access to the private key file.
However, many programs need to prove they are running on a
particular machine without running “as root”,
so cannot access the private key directly. To allow this,
short-lived (typically 1 hour) certificates, called
proxy certificates, are generated that are
signed by the host certificate. The signing process (and so,
generating proxy certificates) requires access to the host's
private key. However, once generated, these short-lived
certificates can have more liberal access policies because, if
stolen, they are only valid for a short period.
Unless the host's private key is directly readable (which is
not recommended), MonAMI needs to have access
to a supply of valid proxy certificates so it can upload data to
an R-GMA server securely. To achieve this, an external script is
run periodically (once an hour, by default) to generate a
short-lived proxy host certificate. Some MonAMI installations
will have no X509-PKI files and no need to upload data to R-GMA.
Because of this, the script
rgma-proxy-renewal.sh (in the directory
/usr/libexec/monami) is
designed to fail quietly if there is no host key and no
certificate installed in their default locations
(/etc/grid-security/hostkey.pem and
/etc/grid-security/hostcert.pem,
respectively).
To generate a proxy certificate, the script will search for one of
the proxy generating commands
(voms-proxy-init,
lcg-proxy-init, ...) in standard locations.
It will work “out of the box” if it can find a
suitable command. If it fails, or its behaviour needs to be
adjusted, the file /etc/sysconfig/monami
should be edited to altered how the script behaves.
All the following options start RGMA_. To save
space, the RGMA_ prefix is not included in the list
below; for example, the option listed as HOST_CERT is
actually RGMA_HOST_CERT.
HOST_CERTThe location of the host certificate, in PEM format. The default value is
/etc/grid-security/hostcert.pemHOST_KEYThe location of the host private key, in PEM format. The default value is
/etc/grid-security/hostkey.pemHOST_PROXY_DIRThe absolute path to the directory in which the proxy will be stored. Any old proxy certificates within this directory will be deleted. The default value is
/var/lib/monami/rgmaHOST_PROXY_BASENAMEThe constant part of a proxy certificate filename. Proxy certificate filenames are generated by appending a number to this basename. The default value is
hostproxyand an example proxy certificate ishostproxy.849PROXY_RENEW_CMDThe absolute path to an
globus-proxy-init-like command. By default, the script will look for one of several commands within several standard locations. Unless the proxy generating command is located in a non-standard location or is called something unusual, it is not necessary to specify this option.MONAMI_USERThe user account MonAMI runs as. By default this is
monami.PERIODHow often the script is run (in hours). By default, this is 1 (i.e., one hour). This variable controls only for how long a freshly made proxy certificate is valid; to change the rate at which proxy certificates are made, the cron entry (the file
/etc/cron.d/monami-rgma) must be altered to a corresponding value.
Dealing with failures
It is possible that, for whatever reason, an R-GMA server may not be able to receive data for a period of time; for example, this might happen if the R-GMA server is down (e.g., for software upgrade) or from network failures. If a rgma target is unable to send the data, it will store the data in memory and attempt transmission later. Transmission of unsent data is attempted before sending new data and also automatically every 30 seconds.
Storing unsent data uses memory, which is a finite resource on any computer. The default behaviour on some computers is to kill programs that have excessive memory usage; those computers that do not kill such programs outright will often “swap” memory to disk, resulting much poorer performance of the computer overall.
To prevent an unavailable R-GMA server from adversely affecting MonAMI, a safety limit is placed on how much unsent data is stored. If the length of the unsent data queue exceeds this limit then the oldest data is thrown away to make space for the new data.
The default behaviour is to limit the backlog queue to 100 datatrees. How quickly this limit is reached will depend on how fast data is sent to an rgma plugin. The backlog queue limit can be altered through the backlog attribute, although a minimum backlog value of 10 is enforced.
Example usage
The following example configuration monitors the
“myservice” processes every minute and records the
number that are in running (or runable), sleep and zombie states.
The data is stored in the (fictitious) R-GMA table myServiceProcessUsage. The table has
three fields: running,
sleeping and zombie. The data delivered from the
process target (srv_procs) is uploaded to
the rgma target (srv_rgma) and matches each
of the three column names.
[process]
  name = srv_procs
  count = procs_running  : myservice [state=R]
  count = procs_sleeping : myservice [state=S]
  count = procs_zombie   : myservice [state=Z]

[sample]
  interval = 1m
  read = srv_procs
  write = srv_rgma

[rgma]
  name = srv_rgma
  table = myServiceProcessUsage
  column = running  : srv_procs.count.procs_running
  column = sleeping : srv_procs.count.procs_sleeping
  column = zombie   : srv_procs.count.procs_zombie
Attributes
- table string, required
the table name MonAMI will append data to.
- column string, required
the mapping between a MonAMI metric name and the corresponding R-GMA column name. In general, there should be a column attribute for each column in the corresponding R-GMA table.
The column attribute takes values like:
rgma column:metric name[options]where
metric nameoptions- rgma_home string, optional
If the usual environment variables are not specified or do not point to a valid
rgma.conffile and rgma_home has been specified, MonAMI will attempt to parse the file rgma_home/etc/rgma/rgma.conffor details on how to contact the R-GMA server.- host string, optional
the host to which MonAMI should connect for submitting data. Default value is
localhost. It is recommended that this value is only used if you do not have anrgma.conffile.- port integer, optional
the
TCPport to which MonAMI should connect when submitting data. Default value is8080when connecting insecurely and8443when connecting securely.- access string, optional
this attribute will determine whether to use
SSL/TLS-based security when connection to the R-GMA server. A value of secure will result in attemptingSSL/TLS-based mutual authentication; a value ofinsecurewill use an insecureHTTPtransport. By default, secure access will be used.- type string, optional
a comma-separated list of R-GMA queries for which the data should be a candidate. Added data will always show up during continous queries. Specifying
historywill mark the data so it is also a candidate for history queries. Similarly, specifyinglatestmarks data so it is also a candidate for latest queries.- storage string, optional
the type of storage to request. This can be either
memoryordatabase. The default value ismemory.- latest_retention integer, optional
when inserting data that is marked for “latest” queries, this is the period of time after data is added that it is guaranteed to be present. The value is in minutes, the default value is 25 minutes.
- history_retention integer, optional
when inserting data that is marked for “history” queries, this is the period of time after data is added that it is guaranteed to be present. The value is in minutes, the default being 50 minutes.
- backlog integer, optional
The maximum length of the unsent data queue whilst waiting for an R-GMA server. If the backlog of datatrees to send to an R-GMA server exceeds this value, then the oldest datatree is thrown away. The default value is 100 with a minimum value of 10 being enforced.
The configuration file can have one or more sample targets (or sample for short). A sample target aggregates information collected from one (or more) targets. The aggregated data is then sent off to one (or more) targets. The targets do this based on either the current time or when another target requests the data. Generally speaking, you want at least one sample target in MonAMI configuration files.
The read attribute describes from which monitoring targets a sample target should get its data. In its simplest form, this is a comma-separated list of monitoring targets. When fresh data is needed, the sample target will acquire data from all the named targets and aggregate the data. The following example takes data from a mysql and apache target.
[mysql]
 user     =  monami
 password =  not-very-secret

[apache]
 name = my-apache

[sample]
 read = my-apache, mysql
Data is made available in a tree structure. sample
targets can select parts of the datatree rather than taking
all available data. Parts of a datatree are specified by
stating the path to the metric or branch of interest. A dot
(.) is used to separate branches within the
datatree. Also, parts of the tree can be excluded by
prefixing an entry with the exclamation mark
(!).
In the following example, the sample target takes the
threads data from the
my-apache target, but not the number of
threads in keep-alive state. The sample also aggregates data
from the mysql target's “uptime” value.
[mysql]
 user     =  monami
 password =  not-very-secret

[apache]
 name = my-apache

[sample]
 read = my-apache.Threads, !my-apache.Threads.keep-alive, \
mysql.uptimeTimed samples are sample targets that have an interval attribute specified. Specifying an interval will result in MonAMI attempting to gather data periodically. This is useful for generating graphs or “push”ing data to reporting targets, such ganglia (see Section 3.5.3, “Ganglia”) or filelog (see Section 3.5.1, “filelog”).
The interval value specifies how long
the sample section should wait before requesting fresh data.
The time is given in seconds by default or as a set of
qualified numbers (an integer followed by a multiplier).
Following a number by s implies the number
is seconds, m implies minutes,
h implies hours, d
implies days and "w" implies weeks.
Here are some examples:
interval = 5every five seconds,
interval = 5severy five seconds,
interval = 2mevery two minutes,
interval = 3h 10severy three hours and 10 seconds.
When triggered by the timer, the sample target collects data and sends the aggregated data to one or more reporting targets. The write attribute is a comma-separated list of reporting targets to which data should be sent.
The following example records the number of threads in each state in a log file every 2 minutes.
[apache]

[sample]
 interval = 2m
 read = apache.Threads
 write = filelog

[filelog]
 file = /tmp/output
As with monitoring and reporting targets, a sample target can be assigned a name using the name attribute. These sample targets are named samples. If no name is specified then the sample is an anonymous sample. As with all other targets, named samples must have names that are unique and not used by any other target.
However, unlike named monitoring and reporting targets, it is OK to have multiple anonymous (unnamed) sample targets. Anonymous samples are given automatically generated unique names. Although it is possible to refer to an anonymous sample by its generated name, the form of these names or the order in which they are generated is not guaranteed. Using an anonymous sample's generated name is highly discouraged: don't do it!
Named samples can be used as if they were a monitoring target. When data is requested from a named sample, the sample requests data from its sources and returns the aggregated information. The following example illustrates this.
[mysql]
 user = monami
 password = something-secret

[apache]

[sample]
 name = core-services
 read = apache, mysql
 cache = 60s

[sample]
 interval = 60s
 read = core-services
 write = filelog

[filelog]
 file = /tmp/output
Adaptive monitoring is a form of internally-triggered monitoring that is not necessarily periodic. Under stable conditions, adaptive monitoring will be periodic; however, if the monitored system takes increasingly longer to reply (e.g., suffers increased load), adaptive monitoring will adjust by requesting data increasingly less often.
Overview
Fixed-period monitoring (e.g., monitoring once every minute) is commonly used to monitor services. This data can be plotted on a graph to show trends in activity, service provision, resource utilisation, etc. It can also be recorded for later analysis. It also allows status information (e.g., number of connected) to be converted into event-based information (e.g., too many connections detected) within a guaranteed maximum time.
When monitoring a service, the data-gathering delay (between the monitored system receiving a request for the current status and delivering the data) should be small compared to the time between successive requests. If you are asking a database for its current status once every minute, it should not take this database 50 seconds to reply! There are two reasons why this is important:
First, it is important that the monitored system is not overly affected by MonAMI. There may be no way of knowing whether an observed large data-gathering delay is due to MonAMI; but whatever the cause, it suggests that MonAMI should not be monitoring so frequently.
Second, MonAMI has no idea whether the data-gathering delay occurred before the service recorded its current state or after. If the size of this uncertainty is about the same size as the sample's interval, then there's little point sampling this often.
Rather than maintaining a constant sampling period (e.g., once every minute), adaptive monitoring works by maintaining a constant duty-cycle. The duty-cycle is the percentage of the period spend “working”. If an activity is repeated every 40 seconds with the system active for the first 10 seconds the duty cycle is 25%; if the situation changes so it's now active for 30s every 40s then the duty cycle will have increase to 75%.
Whenever MonAMI acquires data from a monitored service, it keeps a record of how long it took to get the monitoring data. It uses that information to adjust an estimate of how long the next data acquisition will take. The process is described in Section 3.3.4, “Estimating future data-gathering delays”. This estimate, along with the desired sampling period allows MonAMI to estimate the duty-cycle of the next sample. MonAMI can then adjust the sampling period to try to keep this close to the desired duty-cycle.
In addition to the desired duty-cycle, there are two other parameters that affect adaptive monitoring: a lower- and upper- bound on the delay.
The lower-bound on the delay is the smallest delay between successive requests MonAMI will allow. If a service is so lightly loaded that it is responding almost instantaneously then the lower-bound limit will prevent MonAMI from sampling too fast. The interval attribute gives the lower-bound when MonAMI is adaptively sampling.
The upper-limit is the largest delay between successive requests: the adaptive monitoring will not sample less frequently that this limit. This is useful should, for whatever reason, a service takes an anomalously long time to reply. Without an upper-limit, MonAMI would adjust the sampling interval to compensate for this anomalous delay and might take an arbitrarily long time to return to a more normal sampling period. The sample's limit attribute provides this upper-limit to adaptive monitoring.
Adaptive monitoring as a safety feature
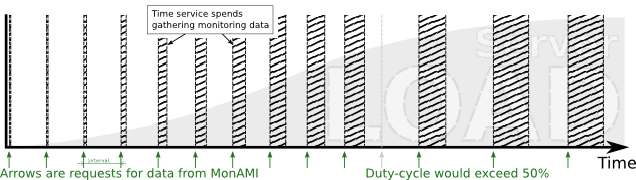
Adaptive mode is enabled by default with a target duty-cycle of 50%. This is meant as a safety feature and anticipates that the observed duty-cycle, under normal conditions, will be less than 50%: if sampling once every minute, we expect gathering of data to take less than 30 seconds.
Whilst the duty-cycle is low, MonAMI will conduct periodic sampling; however, should the measured duty-cycle exceed the 50% limit, the monitoring will switch into an adaptive mode and MonAMI will sample less often. This could be due to any number of reasons; but, once the system has recovered and the duty-cycle has dropped to below the 50% limit, MonAMI will switch off the adaptive timing and resume periodic monitoring.
If MonAMI switches to adaptive monitoring too often then the 50% target may be too low or the sample interval is set too small. Either sample less often (increase the interval attribute) or set an explicit dutycycle attribute value greater than 50%. Specifying a dutycycle value of zero will disable adaptive mode, and so enforce periodic monitoring.
There is currently no support within MonAMI for extending the adaptive monitoring support to include on-demand monitoring flows. This is because none of the currently available on-demand reporting systems provide the facility to indicate that they should sample less frequently.
Adaptive monitoring by default
If a sample target's dutycycle attribute is set to a desired duty-cycle and the interval attribute value is set sufficiently small then the sample will operate in adaptive mode by default. Adaptive monitoring is then elevated from a safety feature to being the normal mode of operation for this sample target.
If no interval is set, a default interval value of one second is used. This places a lower-bound on the sampling frequency: MonAMI will not attempt to monitor more frequently than once per second.
Adaptive monitoring has strengths and weaknesses compared to periodic monitoring. There is greater certainty that the monitoring is not overly affecting your monitored systems. However, adaptive monitoring is a new feature. Support within the various reporting systems for this mode of operating will vary, and analysing the resulting data is more complex.
In summary, each sample section accepts the following options:
- interval period, optional
specifies how often data should be collected. The format is a series of numbers, optionally qualified, separated by white space, for example
1h 2m 30swould repeat every 1 hour, 2 minutes and 30 seconds. Seconds is assumed if no qualifier is specified. The total interval is the sum of all numbers present.If no interval and no duty-cycle is specified, the sample will never trigger data acquisition. Instead it will act as an aggregator of data, requesting data only on-demand.
If a dutycycle attribute is specified, the interval attribute specifies a lower-bound on the sampling period during adaptive mode monitoring. If no interval is specified, a default lower-bound of one second is used. Setting an interval of zero permits arbitrarily short sample periods (not recommended).
- read string, required
a read string specifies which sources to query and which information to report back. The format is a comma-separated list of definitions. Each definition is either a target name or a target name, followed by a period (
.), followed by the name of some part of that target's datatree. If only the target is specified, the whole datatree is referred to; if the part of the datatree referred to is a branch-node, then any data below that branch is referred to. Any definition can be negated by starting with an exclamation mark (!), which makes sure that element is not included in the report. For example:foo, bar, !bar.unimportant, baz.important
would include all data from
foo, all frombarexcept that within thebar.unimportantbranch, and data frombazcontained within theimportantbranch. The namesfoo,barandbazare either defined by some target's name attribute, or the default name taken from the target's plugin name.- write string, optional
a comma-separated list of targets to whom the collected information will be sent. This attribute must be specified if the sample is internally triggered (either interval or dutycycle attributes are set).
- dutycycle percent, optional
the desired or threshold duty-cycle value for monitoring using adaptive mode. MonAMI will measure and adjust the sampling period to keep the measured duty-cycle less than or equal to this value. Upper- and lower-bounds will prevent sampling too infrequently or too often. If the interval attribute is specified but dutycycle is not, a default value of 50% is used.
- limit period, optional
The upper limit to the sampling period for adaptive monitoring. MonAMI will never sample less frequently that this. If not specified, a default value is used. The default value is twenty times the interval attribute, if specified, or twenty minutes if not.
Some monitoring involves capturing that a particular activity
happened, when it happened and some metadata associated with the
activity. A concrete example of event monitoring is watching
file transfers from a web-server: one might wish to monitor for
requests for missing files (404 HTTP status-code) to be alert
to some broken part of a web-site. One might also look for
which parts of a website are under heavy load, so to better
load-balance the operation.
With any event there is some associated metadata. For a web
request, this metadata includes the web-browser's User-Agent
string, the browser's hostname (or IP address), how much data
was transferred, etc. Within MonAMI, this information is
presented as a datatree. Events are merely new datatrees that
can be directed to one (or more) reporting targets.
A monitoring target that provides events typically will split
those events into separate channels. The channels form a
hierarchy of different activity. For example, an
apache target can be configured to provide events based
on HTTP requests the Apache server receives. These events can
be provided as the access channel. Events
from the access channel can be further
divided into events from the access.1xx,
access.2xx, access.3xx and
access.4xx channels based on the resulting
HTTP status-code. The access.4xx channel
is further subdivided based on the actual code, so into
access.4xx.401,
access.4xx.402 and so on.
The dispatch targets describe which events are to be monitored, what information is to be send and to which reporting targets the information is to be sent. Event monitoring works using a subscription model. The dispatch target subscribes to one or more channels to receive events that match. A dispatch that subscribes to a branch (within a channel hierarchy) will receive all events that match any of the more-specific events: subscribing to access.4xx will receive events on channel access.4xx.401, access.4xx.402, access.4xx.403, and so on.
When receiving a datatree, the dispatch can select some subset of the available data. Each event might have a large amount of information that, in some particular case, is not needed. The select attribute specifies which data is needed. It uses the same format as the sample target's read attribute (see Section 3.6.1, “The read attribute”).
Finally, a dispatch section must specify to which reporting target the datatree is to be sent. The send attribute contains a comma-separated list of reporting targets to which the data should be sent.
A simple example is:
[apache]
  log = access: /var/log/apache/access.log [combined]

[dispatch]
 subscribe = apache.access.4xx.404
 select    = apache.user-agent
 send      = apache-404-useragent-log

[filelog]
 name = apache-404-useragent-log
 filename = /tmp/monami-apache-ua.log
The following section contains some example configurations. The first three examples show examples of the three data-flows: on-demand, polling and event monitoring. The fourth example shows a more complicated example, which includes all three monitoring flows.
For simplicity, all examples are presented as a single file.
This file could be /etc/monami.conf, or
(with the default configuration) some file within the
/etc/monami.d/ directory. With complex
configuration, the monitoring targets, reporting targets, and
sample or dispatch targets may be in separate
files (as described in Section 3.2.3, “Auxiliary configuration file directories”). However
the configuration is split between files, provided the targets
are defined the examples will work.
This example shows how to configure MonAMI to monitor multiple targets: a local MySQL database, a local and remote Apache webservers with KSysGuard. The sample acts as an aggregator, allowing KSysGuard to see all three monitoring targets.
The results are cached for ten seconds by the sample target. This prevents the KSysGuard target from sampling too fast, whilst allowing other (undefined, here) monitoring activity to continue at faster rates.
# Our local MySQL instance
[mysql]
 user = monami
 password = monami-secret

# Our local Apache server
[apache]
 name = apache-test

# A remote Apache server
[apache]
 name = apache-public
 host = www.example.com

# Put together monitoring targets for ksysguard.
[sample]
 name = ksysguard-sample
 read = apache-test, apache-public, mysql
 cache = 10

[ksysguard]
 read = ksysguard-sample
The following example configuration has MonAMI recording the Apache server's thread usage and a couple of MySQL parameters. The results are sent to Ganglia for recording and plotting. The Apache and MySQL monitoring occur at different rates (30 seconds and 1 minute respectively).
# Our local apache server
[apache]

# Our database
[mysql]
 user = monami
 password = monami-secret

# Every 30 seconds, send current thread usage to our internal
# ganglia.
[sample]
 interval = 30
 read = apache.Threads
 write = internal-ganglia

# Every minute, send some basic DB usage stats
[sample]
 interval = 1m
 read = mysql.Network.Connections.current, \
        mysql.Execution.Open.tables.current
 write = internal-ganglia

# Ganglia, making sure we send data to an internally connected NIC.
[ganglia]
 name = internal-ganglia
multicast_if = eth1The following example shows event-based monitoring. The apache target is configured to watch the access log file, which contains a log of accesses to the “public” virtual host.
The dispatch subscribes to those transfer requests
that result in a HTTP 404 error code (“file not
found”). Of the available datatree, only the referrer
and user-agent are selected for forwarding to the
public-404-logfile filelog target.
# Our local apache server
[apache]
  log = public_access : /var/log/apache/public/access.log [combined]

# Subscribe to those 404 events, sending them to the filelog
[dispatch]
  subscribe = apache.public_access.4xx.404
  select = referrer, user-agent
  send = public-404-logfile

#  Log these results.
[filelog]
  name = public-404-logfile
  filename = /var/log/apache/public/404.log
The following example combines all three previous monitoring
flows in a single configuration file. Graphs of Apache thread
usage and MySQL database statistics are produced with Ganglia,
HTTP requests that result in a 404 error code are recorded
and KSysGuard can connect to MonAMI (whenever the user
decides) allowing more detailed monitoring either of the Apache or
MySQL services.
Although this example groups similar sections together, this is mainly for readability: the order in which the targets are defined does not matter, and may be split over several files (see Section 3.2.3, “Auxiliary configuration file directories”).
##
##  Reader targets: sources of information.
##

[mysql]
  user     =  monami
  password =  monami-secret

[apache]
  log = public_access : /var/log/apache/public/access.log [combined]


##
##   Samples
##

# Every 30 seconds, send current thread usage to our ganglia.
[sample]
 interval = 30
 read = apache.Threads
 write = ganglia

# Every minute, send some basic DB usage stats
[sample]
 interval = 1m
 read = mysql.Network.Connections.current, \
        mysql.Execution.Open.tables.current
 write = ganglia

# Put together monitoring targets for ksysguard.
[sample]
 name = ksysguard-sample
 read = apache, mysql
 cache = 10


##
##    Dispatches: directing events to writer targets.
##

# Subscribe to those 404 events, sending them to the filelog
[dispatch]
  subscribe = apache.public_access.4xx.404
  select = referrer, user-agent
  send = public-404-logfile


##
##    Writer targets: those that accept data.
##

# Log for any 404s
[filelog]
  name = public-404-logfile
  filename = /var/log/apache/public/404.log

# Listen for ksysguard requests for data.
[ksysguard]
 read = ksysguard-sample

# Ganglia, making sure we send data to an internally connected NIC.
[ganglia]
 name = internal-ganglia
multicast_if = eth1[1] a jiffy is hard-coded period of time. On most Linux machines, it is 10ms (1/100s). It can be altered to some different value, but it remains constant whilst the kernel is running. In practise, the number of jiffies since the machine booted is held as a counter, which is incremented when the timer interrupt occurs.
Table of Contents
When running any software some consideration must be made towards the security impact of that software. MonAMI, like any software, will have an effect on a machine's security risk. This section aims to give a brief overview of the likely security risks and what can be done to to reduce them.
It is worth pointing out that running MonAMI does not, in and of itself, provide any greatly increased security risk. There are no known vulnerabilities in the software and the dangers described here are common for any software that attempts the monitoring activity MonAMI undertakes.
Although this section gives information on running MonAMI it is not, nor can it be, exhaustive. Many of the security issues will arise from site-specific details so a full analysis can only be done in knowledge of the MonAMI configuration in use along with other factors: technical factors (firewalls, network topology, information storage configuration, ..), usage policies (who else uses the machines MonAMI runs on?) and other issues ("what information is considered secret?").
Security as a process, not a check list.
One cannot express security as solely a list of things to check or actions to undertake; this includes the comments in this section. Best-practice (once established) is a guide: a minimal set of activities or configuration. There will always be aspects too general (e.g. management processes) or too site-specific (e.g. has software X been configured with option Y disabled) to be included within best-practice. Security will always require thinking, not just following procedure.
Security in depth.
One cannot rely on any one technology or process to fully protect a site. Limitations in software (or understanding of that software) may lead to a vulnerability in what is thought to be a perfectly protected system. Moreover, local policies might require running software so there are additional vectors of attack: risks might have to be balanced against inconvenience.
An effective way of reducing the impact of security exposure is to provide multiple barriers one must penetrate before a system is compromised. Although each barrier may be imperfect, each will provide a sufficient challenge that either the attacker will give up (and look for an easier target) or the attack is discovered and counter-measures taken.
To illustrate this, consider the mysql monitoring plugin (Section 3.4.8, “MySQL”). This plugin needs a MySQL account with which it can log into the database server. The login credentials could be any valid MySQL user. Although strongly discouraged, this could be the MySQL root user, which has all administrative privileges.
Whatever MySQL user is used, one would try to ensure no one can discover the username-password pair. But, if MonAMI is using a MySQL user with no unnecessary privileges, should someone discover the username-password pair they would gain little without subsequently defeating the user-privilege separation within the MySQL server. The barriers they would have to overcome would be:
gaining access to the machine (presumably as some user other than user monami)
defeating the server's file-system permissions (to read the MySQL password)
defeat the MySQL server permissions (to gain privileges)
Each barrier is formidable yet potentially vulnerable (either through software bug or from being misconfigured). Together, the steps required to obtain full access to the database is much harder, sufficiently hard that an attacker would most likely use some other route.
This section describes some explicit risks that one encounters when running MonAMI. For each section, there are a few suggested things to check. The checks are hopefully straightforward; verifying these items should greatly reduce the risk.
As stated earlier, a list of checks should not be confused with having a secure system. Following best practise should eliminate or greatly reduce the impact of these risks, but the user should be aware of them and plan accordingly.
Sending out information is MonAMI's modus operandi. However, some information is dangerous or sensitive.
Information might be sensitive for any number of reasons. Monitoring might give an indication of capacity or utilisation, or the broad direction in which activity is going. Such information might be sensitive for business. Thieves might target rooms in which computers have been idle for some time.
Dangerous information is not sensitive now, but might be sensitive in the future. Information that indicates which software and software version is being run could be correlated against databases of known vulnerabilities. Distributing software version numbers is the most obvious example of this, but other information might indicate which software is being run.
Check that...
information being sent is not sensitive,
the information systems are sufficiently secure,
no information that might identify which version of some software is being run is distributed where it might be discovered.
The danger here is that someone discovers the username-password pair needed to gain access to some system. The most likely cause is inappropriate file-system permissions.
Using the "security in depth" concepts, passwords should be created with limited functionality, ideally with only sufficient privileges to retrieve monitoring information.
Many password-based authentication systems have the option of restricting from which hosts it will accept credentials. By limiting login via monitoring credentials to be only from the MonAMI host (which is perhaps "localhost"), any stolen username-password pair is useless unless the MonAMI host is also compromised.
Check that...
the MonAMI configuration files are owned by user monami and have read-only permission for that user and no read permission for anyone else.
that user-password pairs used by MonAMI have limited functionality and (ideally) are not shared with other users.
wherever possible, the monitoring username-password pair should be restricted so it only functions from the machine on which MonAMI is running.
Any software can have bugs; MonAMI is no exception. Bugs range from the annoying (doesn't work as specified) through to the dangerous. Perhaps the most dangerous is if, through MonAMI, a remote user can control files or run commands on the local machine.
Although there are no known bugs in MonAMI, it is prudent to assume they exist and to reduce the impact of them. For this reason, MonAMI supports "dropping root privileges" to switch to running as some other user. We recommend that this feature be used and the other user be distinct (i.e. not to use some generic user "daemon" or "nobody"). Someone exploiting MonAMI (should that be possible), would then only gain the use of an unprivileged user.
To achieve monitoring activity, certain MonAMI configurations accepts some network traffic. Wherever possible, the traffic to MonAMI should be firewalled. Only network traffic from trusted machines can reach MonAMI.
Check that...
the monamid process is running as an unprivileged user,
the unprivileged user cannot cause trouble,
network traffic to MonAMI's ports is sufficiently protected; for example, it passes through a suitably configured firewall.
Monitoring impacts on the service that is to be monitored. If MonAMI is run such that it attempts to gather information with high frequency, then it might impact strongly on the service, even providing a denial-of-service attack.
If properly configured, monitoring that is triggered internally (see Section 3.6.2, “Timed sample targets”) should pose no problem. On-demand monitoring (for example, the ksysguard plugin, Section 3.5.6, “KsysGuard”) could potentially request monitoring data sufficiently quickly to saturate MonAMI-core. This might lead to problems with MonAMI and the services being monitored. To reduce this, suitable caches can be defined (see Section 3.3.2, “The cache attribute”) and access to on-demand monitoring should be limited through correctly configured firewalls.
Check that...
suitable cache values are specified, especially for any on-demand monitored targets.
any on-demand monitoring network port is suitably protected; for example, by using a suitably configured firewall.
the MonAMI configuration files are not world-writable and that any auxiliary configuration directories (as defined in a config_dir attribute) does not permit normal users to write additional monitoring configuration.
There are a number of sources for further information:
The MonAMI website contains up-to-date information about monitoring and reporting plugins
The MonAMI blog has comments and ideas on monitoring.
There are various mailing lists for the MonAMI community.
- monami-announce
a very low volume list for people want to know about future releases of MonAMI. To subscribe, visit the mailman page.
- monami-users
a list for people who are using MonAMI. To subscribe, visit the mailman page.
- monami-devel
a list for people who are working on improving MonAMI. To subscribe, visit the mailman page.
Please send feedback about this document (including any omissions or errors) to the developers' mailing list.